- Research
- Open access
- Published:
An analysis of protesting activity and trauma through mathematical and statistical models
Crime Science volume 12, Article number: 17 (2023)
Abstract
The effect that different police protest management methods have on protesters’ physical and mental trauma is still not well understood and is a matter of debate. In this paper, we take a two-pronged approach to gain insight into this issue. First, we perform statistical analysis on time series data of protests provided by ACLED and spanning the period of time from January 1, 2020, until March 13, 2021. After observing the data, it becomes apparent that employing kinetic impact projectiles is correlated with an increase in protests in the following days. Moreover, it serves as a more accurate indicator of the subsequent death toll compared to the mere number of protests. This leads to the conclusion that the utilization of less-lethal weapons appears to provoke rather than quell protests, exhibiting an inflammatory effect. Next, we provide a mathematical framework to model modern, but well-established social psychology research on compliance theory and crowd dynamics. Our results show that understanding the heterogeneity of the crowd is key for protests that lead to a reduction of social tension and minimization of physical and mental trauma in protesters.
Introduction
The United States of America emerged as a free country on August 2, 1776, as a result of protests against England’s colonial rule. Interestingly, in spite of this history, its government and police departments have had a fraught relationship with protesters (della Porta and Reiter, 1998). While the right to protest is protected by the First Amendment, police authorities have historically played a significant role in managing protests, even when they are peaceful demonstrations. Nonetheless, protests continue to be a powerful example of effective collective behavior that can lead to a clear change in the establishment. A notable example is that of the civil rights movement of the 1960’s (Rogers, 1988), and a more recent example is the wave of protests that overtook the country in support of black lives in 2012 after the death of Trayvon Martin (Lebron, 2017). Throughout the years, police departments across the United States have used a variety of protest control strategies, which will be discussed in detail in “Policing strategies background and history” section. A natural question that has inspired much research is that of which strategy is the most effective for managing protests, see (della Porta and Reiter, 1998; Velut, 2020; Maguire, 2015) and the references therein. While this question is far from being answered, evidence from an assessment ordered by the Justice Department’s Office of Community Oriented Policing Services concluded that, in the recent protests/riots that were triggered by the killing of Michael Brown in Furgeson, Missouri by a white police officer in 2014, the police strategy of showing dominant force in an effort to get protesters to comply only escalated the violence (I. for Intergovernmental Research, 2014).
The reasons that bring individuals from all walks of life to gather and protest in mass are varied. However, protests can be interpreted as a sign of high social tension in a system. According to Parson social tension is the tendency to disequilibrium in the balance of exchange between two or more components in a system (Parson, 1951), and accumulated social tension can reveal itself in protest action (Gurr, 1951). Thus, on the one hand, properly managed protesting activity can lead to reduced social tension, when properly controlled, by clearing the air (Cosner, 1956). On the other hand, poorly controlled protests can lead to increased tension, escalated violence, and a further disequilibrium of the system. In fact, there have been many instances of significant physical and mental trauma resulting from violent events that occur during protests and riots (Haar et al., 2017a, b; Ni et al., 2020). This results in a collective trauma that affects not only the individuals experiencing the violence directly but also those who witness it (Ni et al., 2020; Galovski et al., 2016). While the physical injuries occurring in such events are observable and trackable in theory, in practice there is no universal method used to keep track of these data. Instead, we rely on doctors and hospitals to monitor and share details of relevant injuries (Szabo, 2016). Mental trauma is even harder to measure as individuals may not know they are experiencing post-traumatic stress disorder, or a similar mental health condition, and may not seek treatment. Nevertheless, these pose a significant health problem to our society and should not be ignored.
The interaction between protesters and police is complex, particularly because of the competing effects at play. On the one hand, police presence may deter some individuals from committing violent or acts of aggression (AofA), especially when counter-protesters may be present. On the other hand, police can escalate violence or even turn a peaceful demonstration violent (I. for Intergovernmental Research, 2014). Generally, it is difficult to determine which of the competing effects is dominating. The question motivating us is thus: Does police presence mitigate or escalate violence at protests? Our two-pronged approach uses both statistical and dynamic models. We first perform a time series analysis on data from The Armed Conflict Location & Event Data Project (ACLED) database (Raleigh et al., 2010), spanning the period of time from January 1, 2020, until March 13, 2021. This publicly available database is maintained on the ACLED website by experts and is based on a variety of media sources. This data set has events, classified as protests, and riots, to name a few, and contains information such as the date, location, actors involved (e.g., protesters, military, police, etc.), the number of fatalities, etc. These data allow us to explore the effect that things like current events, police involvement, and fatalities have on future events. However, these data lack the depth to be able to fully understand the effect that different police management methods have on the collective trauma of protesters. To accurately tease out the effect of protest policing strategies, accurate, detailed, and transparent data needs to be collected, which is vital for data-driven modeling. In the absence of data, mathematical modeling of relevant social psychology theories can offer an avenue for us to understand the effect that different protest management strategies have on acts of violence and aggression. In Maguire (2015), Maguire argues for a new direction in protest policing based on current social psychology research on (1) compliance theory and (2) crowd dynamics. Here we present and analyze a dynamical systems model based on the psychology research discussed in Maguire (2015). We note that it is difficult to parameterize these models given the current data available. The value of the model introduced here is that it helps us quantify the effects of different policing strategies under the point of view championed in Maguire (2015). These are thought experiments that can help us gain insight into how crowd heterogeneity and protest management strategies have an effect on the collective trauma due to protests. Our work builds on a preliminary analysis (Koulisis et al., 2021), that focused on the effect of police use of kinetic impact projectiles on protest dynamics.
Previous work
Protests are complex social events that have been pervasive throughout history and which have been the subject of intensive research activity, see for example (Braha, 2012; Lang and De Sterck, 2014; Davies et al., 2013). A statistical lens has been taken in Earl and Soule (2010) where the authors categorize five kinds of police responses to protests, ranging from “police do not show up” to “use of arrests and barricades” to “use of tear gas, etc.” and fits a time-series model to the data (albeit with a few statistical flaws). The paper finds that the impacts of police repression techniques tend to be short-term, e.g., 1 week. In Delehanty et al. (2017) the authors analyze the effect that the US Department of Defense 1033 program, which allows the Department of Defense to give state, local, and federal law enforcement agencies military hardware, has on violent behavior among officers. They find a positive and statistically significant relationship between the number of 1033 transfers and fatalities from officer-involved shootings across all models.
There is also a small body of literature studying the mental health effects of exposure to macro-level trauma, such as protests. In First et al. (2020) the authors look at post-traumatic stress (PTS) symptoms caused by the fatal shooting of Michael Brown in August 2014 and subsequent civil unrest in Ferguson, MO. The study found a direct association between the factors of race and protest engagement with PTS symptoms. Media exposure to these events was indirectly associated with PTS symptoms. The authors of Ni et al. (2020) did a meta-analysis of the effect of collective action on mental health. The study collected papers from PubMed, Web of Science, PsycINFO, and CINAHL Plus from their inception until January 1, 2018. One of the factors found to be linked to poorer mental health after participation in a protest was exposure to violence. The authors also point out two studies that showed that collective action could lead to lower levels of depression and suicide, possibly due to the feeling of belonging and social cohesion.
Mathematical models have been used to simulate collective protesting behavior as well. In a study by Davies et al. (2013), a mathematical framework was constructed to analyze the 2011 London riots and the corresponding policing strategies. This model incorporated factors such as the infectious nature of participation, distances traveled to riot locations, and the deterrent influence of law enforcement. Another contribution to this field comes from the work of Berestycki and his team (Berestycki and Nadal, 2010; Berestycki et al., 2015), who introduced a model that examines the interplay between the evolution of protest activity and social tension. In addition, an epidemiological perspective has also been applied to the study of protests. Burbeck et al. (1978) initially proposed this approach, which has subsequently proven effective for fitting data (Bonnasse-Gahot et al., 2018). The mathematical approach of this work bears similarities to recent literature on the use of mathematics in the analysis of uncivil and criminal activities (Short et al., 2008; Berestycki and Nadal, 2010; Schweitzer and Holyst, 2000; Berestycki et al., 2015), showing for instance that patterns, which are useful to understand, emerge when looking at the macroscopic scale.
The previously mentioned studies primarily focus on timeframes spanning several days, largely because the available data is gathered at that resolution. Nonetheless, there seems to be a gap in research when it comes to investigating protest dynamics within shorter intervals, such as minutes or hours, over the course of a single day. Our innovation lies in introducing a mathematical framework designed to address this gap. This framework is founded upon a contemporary socio-psychological theory that pertains to the nature of protesting activity.
Sociological background
Social tension and conflict
Social tension and conflict often go hand-in-hand: social tension precedes conflict but does not always lead to conflict (Artemov et al., 2017). In the sociological literature, social tension is generally defined as pressure felt by a collective. This pressure can result from things like rupture of social ties, increased social anomie (Orru, 1983), or a buildup of mental fatigue and irritability, frustration and deprivation, aggression, and depression of a significant part of society (Smelser, 1994). Social tension, an integral part of all social systems, can spread among the population and manifests itself in mass actions (Bykovsky, 2008). According to Cosner, conflict can serve the very important role of regulating systems that are out of equilibrium, and socially-controlled conflict can remove accumulations of suppressed hostile emotions, thus reducing social tension (Cosner, 1956).
Social tension is recognized to be a natural part of society and while it generally has a negative connotation, it can also play a positive role. Mainly, this quantity can be used to track the potential for conflict (Artemov et al., 2017). While conflict, when managed properly, can be productive, it should be avoided when possible. Thus, tracking social tension at its different stages and making changes in the system to reduce social tension, before conflict arises, would be ideal. Researchers have described different developmental stages of social tension. The initial stage is latent when a negative emotional state begins to emerge in a population without their perception. The second stage is the perception and spread of these negative emotions. These negative emotions can reach a level in a population that manifests itself in conflict or protesting activity (Artemov et al., 2017).
Policing strategies background and history
To fully understand the dynamics of protests in the United States one must understand the interaction between police and protesters. The individual actions of each actor, either police or protesters, modify the environment of the other and thus potentially alter the others’ actions [(della Porta and Reiter, 1998), Part I, Chapter II]. In the United States, police departments have a history of managing protests. This is evidenced by the development of the permitting system used initially by the three major Washington, D.C., police agencies (the National Park Service Police, the U.S. Capitol Police, and the Metropolitan Police of the District of Columbia), which have been replicated by other state capitals [(della Porta and Reiter, 1998), Part I, Chapter II]. It is evident that the outcomes of protests depend not only on the protesters’ intentions but also on their interaction with the police (when present). Therefore, we must understand the history of policing strategies and their potential effect on protest dynamics. In Chapter 2 of della Porta and Reiter (1998) the authors introduce five key characteristics in protest policing practices. These are:
-
1.
The extent of police concern regarding the First Amendment rights of protesters, and police obligations to respect and protect those rights;
-
2.
The extent of police tolerance for community disruption;
-
3.
The nature of communication between police and demonstrators;
-
4.
The extent and manner of arrests as a method of managing demonstrators;
-
5.
The extent and manner of using force in lieu of or in conjunction with arrests in order to control demonstrators.
It is natural to begin in the 1960’s, where the dominant model was an escalated force model. In the escalated force model, police disregard or minimize the First Amendments rights of protesters, do not tolerate any forms of disruptions, have limited communication with protesters, and are quick to arrest protesters (even if laws have not been broken), and use force as a standard method to deal with protesters. Historically, the use of this method led to many arrests, beatings, and deaths of protesters (della Porta and Reiter, 1998), and thus activists called for the introduction of “less-lethal” tools, such as Kinetic Impact Projectiles (KIPs). In that era, such tools probably saved lives, since a rubber bullet is less lethal than a bullet (della Porta and Reiter, 1998).
In the 1980’s and 1990’s, the negotiated management model became the dominant model. In complete contrast to the escalated force model, two primary goals of the negotiated management model were to protect a protester’s First Amendment rights and to save lives. Under this management style, some disruptions were anticipated and a high level of communication between police and protesters was expected. Moreover, arrests and the use of force were only used as a last resort (Maguire, 2015). In this management model, Kinetic Impact Projectiles were unnecessary. In the late 1990’s, the negotiated management model was replaced by the more aggressive approaches known as the strategic incapacitation model, command and control model, and the Miami model (Maguire, 2015). These are all variations of the escalated force model.
Deterrence theory versus procedural justice
The “show of force” policing strategy used during the protests/riots that ensued after the 2014 killing of Michael Brown, is based on deterrence theory, stating that individuals either comply or become defiant based on the cost associated with these actions (Paternoster, 2010). The premise of this theory is that when the police show a forceful presence, for example, starting from the attire that they wear, the arrests that they make, or a more violent show of force, the cost of being defiant will be too high (Paternoster, 2010; Maguire, 2015). An alternative and more modern theory is that individuals make their decisions to comply or become defiant based on what they perceive to be fair (Hinds and Murphy, 2007; Wolfe et al., 2016; Mazerolle et al., 2013). This theory goes by the name of procedural justice and is concerned with how people perceive the fairness of the procedures used by an authority figure. Figure 1b illustrates the four components that are necessary for an interaction between a law enforcement agent and an individual to be deemed fair. There is research evidence that people’s perceptions of procedural justice influence their judgments about the legitimacy of law enforcement (Tyler, 2006). Under the assumption of a process-based model of regulation when law enforcement agents are perceived to behave in an unjust way, “the police and the law are viewed as less legitimate, and people are less likely to comply” (Maguire, 2015) Under the assumption of this theory, any actions by the police that are perceived by the crowds to be unfair will escalate the tension.

Diagrams illustrating the social psychology theories that we aim to provide a mathematical framework for a the factors necessary for productive action and b the four components needed for an interaction to be deemed procedurally just
A body of research from the 2010’s suggests that the “negotiated management” model and de-escalation tactics are most effective, both at controlling protests and preventing violence between protesters and police. For example, an after-action assessment sponsored by the Justice Department’s Office of Community Oriented Policing Services after the killing of Michael Brown found that the heavy-handed police response to protests relied on “ineffective and inappropriate strategies and tactics” that had the “unintended consequence of escalating rather than diminishing tensions.” (Maguire 2015; U. S. D. of Justice 2014).
Social identity theory
Protest policing strategies are heavily developed based on crowd psychology. The classical view of how individuals act when part of a crowd dates back to the French scholar Gustave Le Bon’s 1895 book The Crowd: A Study of the Popular Mind. From Le Bon’s point of view, when an individual joins a crowd, they lose their identity and become an “automaton who ceased to be guided by his will.” A different and more modern perspective comes from social identity theory, which refers to “the way in which people understand how they are positioned relative to others” Hoggs (2016). From this perspective, it is important for authorities to understand the various social identities in a protest in other to use effective and fair policing strategies (Maguire, 2015). Social identity theory later evolved into the elaborated social identity model (ESIM), which allows for the possibility of individuals to shift their social identity temporarily (Drury and Reicher, 1999). It has been argued that treating a group of protesters as homogeneous is extremely dangerous (Maguire, 2015). Nowadays, many protests consist of people from all over the country with a variety of social identities. The ESIM allows for individuals with different social identities to gather and take on a different identity while protesting (Maguire, 2015).
An ESIM perspective posits that ill-advised actions by police can instigate or escalate conflict and violence in crowds (Maguire, 2015; Drury and Reicher, 1999). In evaluating police response as unjust, a protest participant will be more likely to defy police authority or even use violence. It may be the case then that protest participants “will unite around a sense of opposition to the police and the authorities they are protecting (Maguire, 2015; Drury and Reicher, 1999).”
Productive action
From the social psychology theory discussed above, we observe that protesting activity can lead to a reduction of social tension when the management of the protest is adequate. Figure 1a illustrates a Venn diagram summarizing the discussion from above. In particular, we see that protesting action is a consequence of high social tension and a triggering event. If protest participants feel that they have been treated in a procedurally just manner, then protesting can lead to productive action, which we define to be a reduction of tension and the minimization of physical and mental trauma experienced by the protesting group. Our aim then is to understand what protest management models lead to such productive action.
Methods
Data acquisition and cleaning
We analyzed data from The Armed Conflict Location & Event Data Project (ACLED) database, spanning the period of time from January 1, 2020, until March 13, 2021. This publicly available database is maintained on the ACLED website (Raleigh et al., 2010), is based on a variety of media sources, and is maintained by experts. Each row is an event (e.g., a protest, riot, or strategic development), and 29 columns contain information related to the type of event, date, location, actors involved (e.g., protesters, military, police, etc.), the number of fatalities, and a ‘notes’ field describing the event.
We curated the data to focus on protests in the USA. We then employed text processing algorithms to identify (based on the ‘notes’ field) which protests involved ‘kinetic impact projectiles’ (KIPs), i.e., police use of rubber bullets, foam rounds, bean bag rounds, or tear gas. We then wrangled the data into a new data frame where each row is a day, with columns of time series telling how many protests happened that day, how many fatalities were associated with the protests that day, and how many protests involved KIPs.
Statistical analysis
We conducted a cross-correlation analysis to identify the leading/lagging relationships among these time series. Additionally, we employed ARIMA models to assess the dependency of each time series on its own past. Subsequently, we utilized multivariate models, such as predicting the number of protests based on the usage of KIPs, enabling us to quantify the impact of a single protest involving KIPs on the overall number of protests in the following days. To select the most appropriate models, we relied on the Akaite Information Criterion (AIC), an information-theoretic measurement. The model with the lowest AIC was deemed the most likely to accurately forecast future data (Shumway and Stoffer, 2017).
Below is a concise explanation of ARIMA models, adapted from (Shumway and Stoffer, 2017). An ARIMA model comprises three components: an autoregressive (AR) part, an integrating part, and a moving average (MA) part. To begin, the time series must be made stationary, meaning its mean, variance, and autocorrelation structure should remain constant over time. If the time series, denoted as \(x_t\), is not stationary, we apply the differencing operator \(\Delta x_t = x_t - x_{t-1}\) to achieve stationarity. The differencing operator can be iterated if required. The “integrating part” of an ARIMA model indicates the number of differencing transformations applied. Once the transformed variable, denoted as \(X_t\), becomes stationary, we employ autocorrelation plots, partial autocorrelation plots, and lag plots to determine the appropriate number of AR and MA parts in the model. These components govern the number of lags of \(X_t\) and the error term \(\epsilon _t\) to be included in the model. For example, an ARIMA(3,1,2) model means we work with \(X_t = \Delta x_t\), and we model \(X_t\) as a linear function of three AR lags \(X_{t-1}, X_{t-2}, X_{t-3}\) and two MA error lags \(\epsilon _{t-1}\) and \(\epsilon _{t-2}\). In other words, we express the model as:
In the context of this model, if \(\beta _1 > 0\), and \(X_t\) represents the number of protests on day t, it indicates that following a day with a high number of protests, we can anticipate an even greater number of protests the next day. Similarly, when \(\alpha _1 > 0\), it suggests that if yesterday experienced an unusually large number of protests, today is likely to witness a larger number. These specific ARIMA models describe self-exciting time series.
A seasonal ARIMA (SARIMA) model takes into account seasonal lags, such as \(X_{t-7}\), representing the number of protests seven days ago, or \(\epsilon _{t-7}\), which denotes a shock event from the previous week. The ultimate objective is to make the vector of residuals, \(\epsilon _t\), random and independent, signifying the absence of further autocorrelation. Specifically, the correlation between \(\epsilon _t\) and each \(\epsilon _{t-h}\) should be statistically insignificant according to both the autocorrelation function and the Ljung–Box test.
Using the given modeling framework, we identified that the most suitable model for the number of protests is a SARIMA (3,1,2) × (2,0,0) (Braha 2012). This means that after applying first-order differencing, \(X_t\) is influenced by the occurrences of protests in the past three days, the unusual nature of protests in the previous two days, and also takes into account events from seven and fourteen days ago due to the seasonal AR(2) part. Differencing was necessary to address the non-constant mean and variance of the time series over time, especially during the significant spike in the number of protests observed in the summer of 2020.
Let \(p_t\) (representing the number of protests), \(k_t\) (representing protests with kinetic impact projectile (KIP) usage), and \(d_t\) (representing fatalities) denote the occurrences on day t. Our cross-correlation analysis revealed strong positive correlations between \(p_t\) and \(k_t, k_{t-1}, k_{t-2}, k_{t-3}\), \(k_{t-4}\), and \(k_{t-5}\). This indicates that KIP usage is associated with an increase in the number of protests in the subsequent days. The statistical significance of these correlations was observed at lags zero, one, and three. Similarly, \(d_t\) showed a positive association with \(k_t\), \(k_{t-1}\), and \(k_{t-2}\), implying that KIP usage is associated with an increase in fatalities in the subsequent days. These correlations were statistically significant at lags zero and one.
Next, we fit models to predict \(p_t\) based on its own past and based on \(k_t\). The best-fitting ARIMA model (chosen by AIC) for protests as a function of KIP use involves the number of protests on the previous day, the number of protests seven days earlier, the number of KIPs used, and the error terms from the previous day and the day before that. Controlling for the effect of the past, every protest in which KIPs were used was associated with 22.5 more protests, and this is statistically significant (\(p < 0.001\)). We note that, due to a lack of normality of the residuals, this p-value was obtained nonparametrically, using randomization-based inference. When including each of the days in the past 2 weeks, each KIP usage was associated with 19.32 more protests the next day \((p < 0.001)\), and 15.9 more protests a full week after the KIP usage. Lastly, we fit models to predict \(d_t\) based on its own past and based on \(k_t\). We find that each use of KIPs was associated with 0.134 more deaths the same day, and 0.129 more deaths the next day (both with \(p < 0.001\)). Furthermore, KIP use was a better predictor than the number of protests, for deaths.
A dynamics perspective
To better understand the complex interactions between the police managing a protest and the protesters themselves, we develop a mathematical model based on the social psychology theory discussed above. In particular, we assume that protesters evaluate interactions with police from a procedural justice lens. Moreover, moving away from Le Bon’s point of view, we assume that protesters have heterogeneous backgrounds and intentions and that they can shift their intentions dynamically based on police-protester interactions. The mathematical framework we develop is based on evolutionary game theory, which has been widely used to study animal and human behavior, see (Berenji et al., 2014) and references therein. In this framework, one can observe players employing different strategies based on the different interactions that occur. Our goal is to provide a way to quantify the effect of different protest management strategies under the assumptions discussed in “Sociological background” section. In particular, this framework allows us to see the dynamics of protests unfolding as time evolves.
For simplicity, we assume that a protest has two types of actors (or players): police agents and protesters. Within the protester groups, we consider that there are subgroups with different values (Drury and Reicher, 2000). For simplicity, we subdivide our protesters into disruptive demonstrators and moderates. In this way, we can tease out the effect of subgroups with different values and intentions on how the protests unfold in a simple setting. Such a split is common in the conflict sociological literature, see for example (Nicoara and White, 2016). We assume that disruptive demonstrators have some probability of perpetrating an act of aggression, which could be something as simple as throwing a water bottle or something more violent. These disruptive demonstrators could be individuals who truly support the cause and are open to becoming aggressive if the situation calls for it. However, this group could also have members who do not support the cause and are simply there to create havoc. For example, in some Black Lives Matters protests, members of white supremacist groups show up to agitate the crowd (Bloom, 2020). Another interesting example where this occurred was during Ukraine’s Revolution of Dignity, which occurred from late 2013 to early 2014, when the Ukrainian government paid militia to attend protests and incite violence (Marples and Mills, 2015).
Police and protesters make different choices as the progress of the protest. Police make the choice of whether or not to commit an act of aggression. Their decisions are informed by the management model in place (we consider the escalated force model versus the negotiated management model) and also by the choices made by the protesters. Disruptive demonstrators also make the choice of whether or not to commit an act of aggression (defiance). This choice is informed by the number of acts of aggression (AofA) committed by the police and also by fellow protesters. In essence, we are assuming that an escalation of violence or acts of aggression occurs. Moderates do not perpetrate any acts of aggression but do have a choice of whether or not they will become a disruptive demonstrator. In making this choice, moderates observe the choices that police make and judge them using a procedural justice lens. All protesters have the choice to leave or stay at each time step.
An evolutionary game theoretic model
Let us assume that there are N protesters at the beginning of a given protest. Let \(N_a(t)\) and \(N_m(t)\) denote the number of disruptive demonstrators and moderates, respectively. For simplicity, we assume that \(N_a(t)+N_m(t)\le N\) for all time, so that no new protesters arrive, but protesters eventually leave. In reality, there are certainly cases where new individuals join a protest. This could be included in the model with ease; however, we seek the most parsimonious model that will allow us to tease out the effects of different protest management models, and including an influx of new protesters will not change the dynamics (except to potentially increase magnitudes of the acts of aggression or prolong the protest). Denote the number of disruptive demonstrators at time t by \(u_1(t),\) the number of moderates by \(u_2(t)\), and the number of police present at time t by p(t). As time evolves we keep track of the number of acts of aggression (AofA) perpetrated by the disruptive demonstrators that have occurred by time t and denote this quantity by \(v_1(t)\). Moreover, we keep track of the number of acts of aggression or arrests made by the police that have occurred by time t and denote the quantity by \(v_2(t)\). Finally, we denote the social tension in the system at time t by \(\tau (t)\), or just \(\tau\) if t is clear from the context. We summarize these variables and their description in Table 1.
The choices of protesters
In light of the above discussion, we assume that in making the choice of whether or not to commit an act of aggression, disruptive demonstrators will consider competing factors. On the one hand, police presence will provide a deterrence effect, while high social tension will increase the likelihood of committing an act of aggression. Thus, we assume that the probability that an aggressive act is committed by a particular disruptive demonstrator during a period of time \(\delta t\) is given by:
where \(\tau _c\) represents a critical threshold of the social tension required for an aggressive act to occur and \(T_1\) the intensity. The function \(f_1\) is a step-function modeling an all-or-nothing response. In reality, individuals have different thresholds of social tension necessary to commit an act of aggression. We see \(\tau _c\) as a “mean-field” parameter governing the choices of the populations of disruptive demonstrators as a whole. We will analyze what happens when \(\tau _c=0,\) which corresponds to the case where disruptive demonstrators will commit acts of aggression independent of the social tension. Another suitable choice for \(f_1\) could be a Sigmund-type function. We also point out that we view arrests as acts of aggression even if they are “justified”. This is a simplification given that some protesters may view certain arrests as warranted. However, this is mitigated by how moderates perceive fairness and make decisions to either stay moderate, become a disruptive demonstrator, or leave the protest. In particular, moderates have the choice of becoming disruptive demonstrators and they make this decision by evaluating the fairness of protester-police interactions. Specifically, if they perceive the police management to be unfair, they will be more likely to become disruptive demonstrators. One way to measure fairness is to consider the fraction of acts of aggression that are perpetrated by the police relative to the total number of acts of aggression. In other words, if moderates see that the protesters are being too destructive and violent, they may deem arrests and police acts of aggression as warranted. On the other hand, if the police are too heavy-handed, the moderates may be more likely to join the disruptive demonstrators. We choose to measure this by the quantity \(\frac{v_2}{v_2 +v_1+1},\) where the one in the denominator is to avoid division by zero. The selection of one positive quantity over another in the denominator was made arbitrarily. While this selection does influence the magnitude of the solutions, it does not change their fundamental qualitative characteristics. Given that our emphasis is on the qualitative behavior of the solutions and since there is no accessible data for model fitting, this particular selection holds no relevance to the outcomes. In the end, the probability that a moderate becomes a disruptive demonstrator during the time interval \(\delta t\) is:
where the function \(f_3\) has a similar form to \(f_1\), but with potentially a different critical threshold. At any given time in the protest, all protesters have a choice to exit the protest and they do so at a rate denoted by \(\epsilon .\)
The choice of the police agents
The choice that police agents have is whether or not to commit an act of aggression directed toward the protesters or to arrest protesters. As mentioned earlier, we aggregate these two and refer to both actions as acts of aggression. We assume that the probability of an act of aggression being committed by the police depends on the number of acts of aggression taken by the protesters, which is the quantity \(v_1\). Thus, we arrive at the following term:
where \(v_c\) represents a critical number of acts of aggression that must occur before the police engage in the use of force and/or make arrests, and \(T_2\) is the intensity. In this work, we consider the escalated force and the negotiated management models as the two main protest policing strategies. The differences in the models lead to different model parameters.
The escalated force model is characterized by little to no tolerance of disorder of the protesters, and police are quick to arrest. Thus, the threshold \(v_c\) is zero or something very small. Moreover, there is no communication with protesters and little to no respect for protesters’ First Amendment rights. We assume that police presence thus leads to an increase in social tension. Even some police acknowledge that deploying police in riot gear can backfire. Some quotes from police officers found in Maguire (2015) that are of interest are: in relation to officers wearing riot gear, “it incites a type of reaction that might backfire and agitate;” “once the hats and bats and turtle suits come out, it brings aggression with it.”; “if you line up a bunch of police officers with riot gear and shields, you are telling protesters ‘to go ahead and throw rocks and bottles at us’.”
On the other hand, the negotiated management model is characterized by a much higher tolerance towards disorder and acts of aggression by the protesters. In that model, arrests and the use of force is a last resort. Moreover, there is a great deal of communication and respect towards protesters. Thus, in this model, the threshold \(v_c\) is much higher and police presence can help diffuse tensions since the communications between police and protesters are open.
The evolution of the social tension
As described in the introduction, social tension precedes protesting activity and conflict. The goal is to have productive action that can lead to a decrease in social tension with a minimum amount of physical and mental trauma, both for police and protesters. We make the assumption that, regardless of the police management strategy being used, the social tension increases with the total number of acts of aggression, \(v_1+v_2,\) and has a natural decay with time:
where \(\omega\) is the rate of decrease if the number of aggressive acts remains static and \(\theta\) the increase in social tension per act of aggression. The difference in communication strategies for the two management models that we consider can be modeled in the parameter \(\theta .\) In particular, a situation where police are in communication with protesters, e.g., asking protesters about the reasons they are participating, can help attenuate the effects of acts of aggression, leading to a lower \(\theta .\) On the contrary, a lack of communication can enhance the effect that an act of aggression has on social tension, leading to a higher \(\theta .\)
The time evolution of protesters and acts of aggression
The flowchart in Fig. 2 illustrates how a given protest evolves. Specifically, it shows the choice-making process of the protesters depending on which category they belong to, and how the system is updated depending on these choices. We can thus develop updated rules for this protest participation game as time evolves. Using the probability \(P_{u_1}(\delta t)\) that a given disruptive demonstrator commits an act of aggression during a period of size \(\delta t\), we obtain that the total number of acts of aggression perpetrated by disruptive demonstrators by time \(t+\delta t\) is given by:
From Eq. (5) we observe that as the tension increases, the number of acts of aggression perpetrated by the disruptive demonstrators also increases. On the other hand, there is a deterrence effect at play as the presence of more police members lowers the probability of an act of aggression happening. The competition between tension, which enhances acts of aggression, and police presence which inhibits them, is modulated by the parameter \(T_1.\) Specifically, \(T_1<<1\) implies that deterrence is the dominant factor, \(T_1>>1\) implies that the tension dominates the dynamics, and \(T_1\approx 1\) balances the two effects. In a similar fashion, we can obtain the updating rule for the total number of acts of aggression perpetrated by police members by time \(t+\delta t\). Using the probability that a particular law-enforcement agent commits an act of aggression, given by Eq. (3), we obtain the equation:
As we see from Eq. (6) the higher the variable \(v_1(t),\) the more likely that a police agent will commit an act of aggression. Also, recall that there is a critical threshold, \(v_c\), separating regions of zero acts of aggression perpetrated by the police agents and an escalating amount of acts of aggression perpetrated by the police. We equate an escalated force management model with small values of \(v_c\) and a negotiated management model with large values of \(v_c.\)

Protesters activity flow-chart
The number of disruptive demonstrators at time \(t+\delta t\) depends on how many exit the protest and how many moderates become disruptive demonstrators. For simplicity, we assume that all disruptive demonstrators who commit an act of aggression either decide to leave the protest or are arrested. This modeling choice has precedent; in Short et al. (2008) criminal agents are assumed to lay low for a while after committing a crime. Another way to interpret this modeling assumption is that we count all of an individual’s acts of aggression as one. With this in mind, we obtain the updating rule given by:
Here and below, we write \(v_1\) instead of \(v_1(t)\), etc., to streamline the formulas. Since moderates either become disruptive demonstrators during a period of size \(\delta t\), with probability given by (2), or exit at rate \(\epsilon\), we obtain the updating rule for moderates:
Dynamical system approximation
In this section, we approximate the evolutionary game theory described above by its dynamic systems counterpart. By taking the limit as \(\delta t\rightarrow 0\) and linearizing all probabilities in Eqs. (4)–(8) and we obtain a system of five coupled and nonlinear ordinary differential equations for the probability density functions of each of the variables, which is as follows:
A natural assumption on p is that it is eventually zero. For example, if there are no protesters then it should hold that \(p=0.\) We thus assume that:
-
(A1)
\(0\le p\) for all t and \(p(t)=0\) if \(u_1(t)+u_2(t)=0.\)
It should be noted that when developing mathematical models, especially those not derived from fundamental principles like in the context of physical phenomena, certain decisions need to be taken regarding the choice of functions to represent specific components within the model. In our specific scenario, we chose to employ step functions as the options for functions \(f_1\), \(f_2\), and \(f_3\). Nonetheless, there are various alternative functions that could have been chosen, as long as they maintained monotonic increase and boundedness. Nevertheless, we anticipate that the model’s outcomes will not be significantly impacted by the particular selections we have made.
Estimates of the solutions
Note that the number of protesters will eventually be less than one, due to the flux being negative. Of course, because the system models the dynamics of a continuum population, the number of protesters will approach zero, but never achieve it. Moreover, condition (A1) guarantees that the number of police will eventually be zero. In fact, the third and fourth components of the solution satisfy the upper bounds:
This implies that \(\frac{dv_1}{dt}\rightarrow 0\) as t increases and the number of acts of aggression committed by the protesters will taper off. However, if the police begin committing acts of aggression, the tension will increase and could eventually lead to disruptive demonstrators becoming aggressive. One can also see that under the following conditions, there will be zero acts of aggression:
-
(i)
\(\tau (0)<\tau _c\), \(v_1(0)=v_2(0)=0.\)
-
(ii)
\(u_1(0)=0\) and \(v_1(0)=v_2(0)=0.\)
On the other hand, the following conditions guarantee positive \(v_1\) and \(v_2\) for \(t>0.\)
-
(i)
\(\tau (0)>\tau _c\), \(u_1(0)>0.\)
-
(ii)
\(\tau (0)<\tau _c\) and \(v_2(0)>0.\)
Results
In this section, we analyze system (9). First, we study and illustrate the wide range of behaviors of the solution depending on model parameters. We are particularly interested in case studies analyzing the effect of different protest management models in homogeneously moderate crowds and the effect of heterogeneous crowds.
Solution dynamics and sensitivity analysis
In this subsection, we study the dynamics of the solutions to Eq. (9). Note that the exit rate of protesters and the natural decay of the tension have an effect on the duration of the protest. For the following analysis we choose to set \(\epsilon =.02\) and \(\omega =.01.\) Moreover, we fix \(f_3(z)=\frac{1}{10}\mathbbm {1}_{z>2},\) where \(\mathbbm {1}\) is the characteristic function.
It is of interest to consider case studies with different initial conditions and to study the sensitivity of the system to the remaining parameters. Specifically, we perform local and global sensitivity analysis for parameters \(T_1, T_2,\theta ,\tau _c\), and \(v_c.\) To accomplish the global sensitivity analysis we use the R function senseRange(), where a distribution is defined for each sensitivity parameter, and the model is run a large number of times, each time drawing values for the sensitivity parameters from their distribution. Here we assume a uniform distribution for all parameters within certain relevant ranges that are shown in Table 2. The senseRange() function produces envelopes around the sensitivity variables, see Fig. 3 for an example. The turquoise envelope represents the range from the minimum values of the solutions up to the maximum values of the solutions. The blue envelope is the average dynamics plus/minus a standard deviation (which is why the dynamics dive into a negative regime). The local sensitivity analysis is done using the R function sensFun(), which estimates the local effect of the parameters on unknowns. This is done by calculating a matrix of sensitivity functions, which are the rates of change of the unknowns with respect to the parameters. In this section, the system of equations is solved using the deSolve library in R.

Local and global sensitivity analysis for case study 1(i) for parameters \(T_1,T_2,\theta , \tau _c\) and \(v_c.\) The other parameters are set to \(\epsilon =.02, \omega =.01.\) The initial conditions are set to \(v_1(0) = 0, v_2(0) = 1, u_1(0) = 0, u_2(0) = 500, \tau (0) = 2\) and \(p=100\) while the protest lasts
Case study 1: Homogeneously moderate crowd
We first consider the situation where there is a homogeneously moderate protest. In other words, there are no disruptive demonstrators in the crowd initially. Particularly, we consider two sets of initial conditions to differentiate between a non-aggressive versus aggressive police strategy.
-
(i)
No initial acts of aggression from police: Due to the homogeneity of the crowd if there are no initial acts of aggression by the police, then there is no sensitivity to the parameters and no acts of aggression from either protesters or police occur. The tension dissipates with time and moderates eventually leave and the protest comes to an end. We classify this case as a productive protest.
-
(ii)
Single initial act of aggression from police: A single act of aggression perpetrated by the police changes the dynamics significantly with this homogeneously moderate crowd. This could, for example, be a single arrest. Figure (3) illustrates a global sensitivity analysis to parameters \(T_1,T_2,\theta ,\tau _c\) and \(v_c.\) The top three and the first two bottom panels in Fig. 3 illustrate the global sensitivity of solutions with initial data set to
$$\begin{aligned} v_1(0) = 0, v_2(0) = 1, u_1(0) = 0, u_2(0) = 500, \tau (0) = 2 \end{aligned}$$and \(p=100,\) while the protest lasts. The black line illustrates the average dynamics of each of the five unknowns. We observe, for example, that the AofA perpetrated by the police and the disruptive demonstrators increases on average. Moreover, the number of disruptive demonstrators sharply increases and then decays very quickly. Note that the dynamics here show little sensitivity to the parameters. The dynamics of the moderates will always decrease. The bottom left graph illustrates a local sensitivity analysis. From the bottom right panel in Fig. 3 we observe that the system is most sensitive to \(T_1\) and \(T_2.\) However, the sensitivity is due to the effect that these parameters have on the number of acts of aggression. Clearly, the higher the \(T_1\) and \(T_2\) are the more acts that occur. We observe that the dynamics of the moderates and disruptive demonstrators are not very sensitive to the parameters. On the other hand, the number of AofA perpetrated by the police and by the disruptive demonstrators are very sensitive to \(T_1\) and \(T_2.\) Here we have a situation where a minimally aggressive police presence can significantly increase the number of AofA.
Case study 2: A heterogeneous crowd
We now look at what happens with an initial crowd that is heterogeneous. Specifically, we analyze what happens when twenty percent of the protesters are disruptive demonstrators at the start of the protest. We aim to analyze the evolution of the protest depending on when the police enter the picture.
-
(i)
Police presence from the start of protest: We explore what happens when the police are present from the beginning. Figure 4 illustrates a global sensitivity analysis for this situation. The initial conditions for all runs are set to
$$\begin{aligned} v_1(0) = v_2(0) = 0, u_1(0) = 100, u_2(0) = 400, \tau (0) = 2 \end{aligned}$$and \(p(t)=100\) for all times when there are more than one protesters. In this situation, we observe that the dynamics of the disruptive demonstrators and moderates are much more sensitive to the parameters. We see a maximum of 30 AofA from protesters and around 400 AofA from the police. Although the averages are around 2.5 and 10 AofA for protesters and police, respectively. Unlike the dynamics of the disruptive demonstrators in Case Study 1 (ii) where the disruptive demonstrators always increased, in this case study we observe that on average the number of disruptive demonstrators actually decreases. In the scenarios where they increase, they increase to a smaller number than that observed in Fig. 3.
Fig. 4 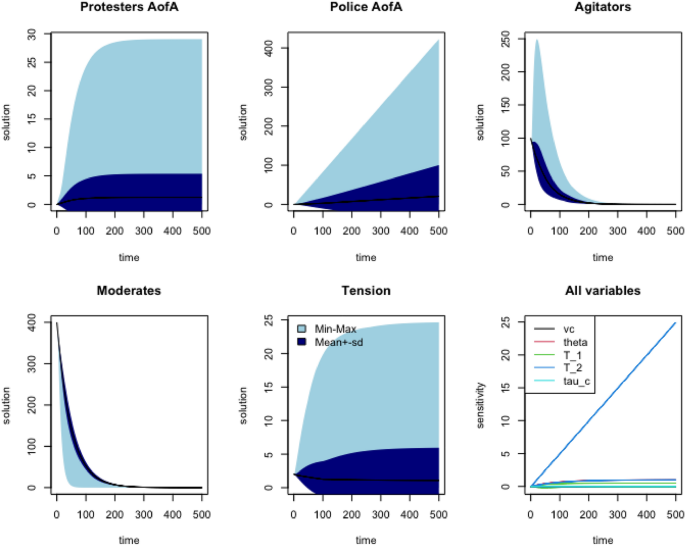
Local and global sensitivity analysis for case study 2(i) for parameters \(T_1,T_2,\theta , \tau _c\) and \(v_c.\) The other parameters are set to \(\epsilon =.02\) and \(\omega =.01.\) The initial conditions are set to \(v_1(0) = 0, v_2(0) = 0, u_1(0) = 100, u_2(0) = 400, \tau (0) = 2\) and \(p=100\) for the duration of the protest
-
(ii)
Late entrance of the police: Next, we consider what happens when the police show up later in the protest. We maintain the same initial conditions: \(v_1(0) = v_2(0) = 0, u_1(0) = 100, u_2(0) = 400, \tau (0) = 2.\) However, we switch the police presence function to \(p=0\) for \(0<t<10\) and \(p=100\) for the remainder of the protest (until there is less than one protester). That is, there is no deterrence for disruptive demonstrators during the first ten units of time. The global sensitivity analysis for this case study is illustrated in Fig. 5. Compared to the previous case study, we see an increased number of AofA both for police and protesters, from an average of 10 to around 50 for the police and from 2.5 to around 15 for protesters.
Fig. 5 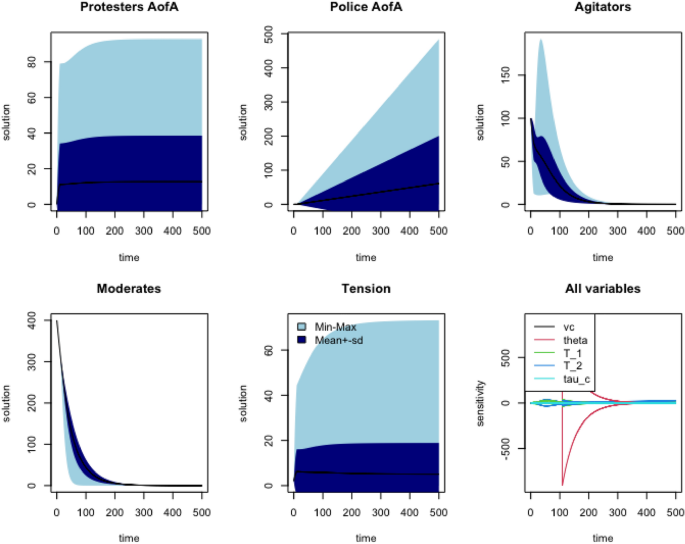
Local and global sensitivity analysis for case study 2(ii) for parameters \(T_1,T_2,\theta , \tau _c\) and \(v_c.\) The other parameters are set to \(\epsilon =.02\) and \(\omega =.01.\) The initial conditions are set to \(v_1(0) = 0, v_2(0) = 0, u_1(0) = 100, u_2(0) = 400, \tau (0) = 2\) and \(p=100\) after \(t=10\) and for the remainder of the protest


Dynamics of the protest
The two different police management models we are considering lead to different parameters. Note that in the escalated force model there is little to no tolerance for disruptions from the protesters and the police are quick to use force and arrests. This can be incorporated by using a low value for \(v_c\). Moreover, it can also be incorporated by a larger value of \(\theta ,\) however we will not explore the effect of this parameter in the present paper. On the other hand, in the negotiated management model, police only use force and arrests as a last resource, leading to higher values of \(v_c\) (and lower values of the parameter \(\theta\)). In this section we fix \(f_3(z)=\frac{1}{10}\mathbbm {1}_{z>5}.\) All simulations in this section were run using Matlab’s ode45 solver.
Heterogeneous crowds
In this section, we perform a thorough exploration of the effect that \(\tau _c\) and \(v_c\) have on the dynamics of the system depending on the ratio of disruptive demonstrators and moderates. To achieve this we ran a large number of simulations where we fix all parameters with the exception of \(\tau _c\) and \(v_c\). In all of the simulations that are discussed in this section, we fix the values:
and vary the ratio of disruptive demonstrators to moderates.
Figure 6 contains two heat maps illustrating in panel (a) the total number of AofA perpetrated by the police and in panel (b) the total number of AofA perpetrated by the protesters. Figure 6a illustrates a clear phase transition between a large number of AofA and zero. The boundary at \(\tau _c = 5\) is the result of the initial tension being set to \(\tau (0)=5.\) Thus, when \(\tau _c >5\) there are no AofA committed by the protesters (as seen in Fig. 6b). Since \(v_1\equiv 0\), this implies \(v_2\equiv 0\), except in the case when \(v_c=0\) in which case there is some AofA committed by the police. This is the thin aqua-blue line seen on the \(v_c =0\) axis. We see that the boundary between aggression and no aggression shifts left as \(\tau _c\) decreases. Interestingly, this shows that when a crowd has a lower triggering point for committing AofA the police should be even more tolerant if they want to minimize how many AofA are committed. The shift from a high number of AofA to zero at the \(\tau _c=0\) axis occurs when \(v_c =9\) because the max number of AofA committed by protesters is nine. Shifting to Fig. 6b we see that to the right of the phase transition boundary observed in Fig. 6a there are still some AofA committed by the protesters. However, we see a shift to smaller numbers as \(\tau _c\) increases.

The number of acts of aggression perpetrated by the a police and b protesters as a function of \(\tau _c\) and \(v_c.\) The ratio of disruptive demonstrators to the total number of protesters is taken to be \(A/N=.2.\) The parameters used here are \(T_1 =.1, T_2 =.01, \theta =.2, \omega =.01, \epsilon =.01.\) The total number of protesters is 500 and \(p=100\) while \(u_1+u_2>1.\)
The heat maps illustrated in Fig. 7 are the results of simulations with the exact same parameters and initial conditions as those used to generate Fig. 6, except the initial ratio of disruptive demonstrators to the total number of protesters increased from \(A/N=.2\) in Fig. 6 to \(A/N=.4\) in Fig. 7. As expected, we see an increase in the number of AofA for both protesters and police. Moreover, for a given value of \(\tau _c\) the regions with a positive number of AofA perpetrated by the police have increased. That is, the larger the number of disruptive demonstrators, the higher the police tolerance ought to be to avoid violence. An interesting feature that is observed in Fig. 7b is that there is another phase transition between the total number of AofA perpetrated by the protesters (on the bottom left corner) as \(v_c\) increases. There is a sharp drop in the number of AofA around \(v_c=1.1.\)

The number of acts of aggression perpetrated by the a police and b protesters as a function of \(\tau _c\) and \(v_c.\) The ratio of disruptive demonstrators to the total number of protesters is taken to be \(A/N=.4.\) The same parameters are used as those given in Fig. 6
In Fig. 8 we have increased the number of disruptive demonstrators to half of the total protesters. One can observe that the horizontal phase transition has shifted to around \(v_c=4.8.\)

The number of acts of aggression perpetrated by the a police and b protesters as a function of \(\tau _c\) and \(v_c\) when the ratio of disruptive demonstrators to the total number of protesters is \(A/N=.5.\) The parameters used here are the same used for the simulations in Fig. 6
Some key takeaways from these simulations are that there is a clear phase transition between the number of AofA committed by the police, going from zero to a significant number. When \(\tau _c\) is higher, \(v_c\) needs to be higher in order for the AofA perpetrated by the police to remain. As the number of initial disruptive demonstrators increases we also see a second phase transition appear, where there is a small, but clear drop between the number of AofA committed by the protesters.
Entrance time versus heterogeneity of the crowd
In this section, we analyze the effect that police entrance time has on the dynamics of the protests. In particular, we are interested in how the total number of AofA perpetrated both by the police and protesters changes when we shift the police entrance time and the composition of the crowd. All of the simulations used to generate the heat maps in this section used the following initial conditions: \(v_1(0)=v_2(0)=0.\) Moreover, \(N=500\) and \(p=100.\) Here we vary the number of initial disruptive demonstrators and the police entrance time.
Figure 9 illustrates the number of AofA by the police and protesters when \(\tau _c = 5\), \(v_c =15,\;T_1=.1\) and \(T_2=.001.\) The first thing to note is the sharp phase transition seen in Fig. 9a. As the number of initial disruptive demonstrators increases, the entrance time of the police matters more. That is, as the initial number of disruptive demonstrators increases the sooner the police must enter to reduce the number of AofA perpetrated by the police. However, after around \(u_3(0)=350\), the entrance time does not matter as much for the total police AofA. We see a similar pattern in a number of AofA perpetrated by the protesters, see Fig. 9b. However, there is a gradual change in the number of AofA perpetrated by the protesters. In fact, in the top right corner, we see a concentration of high numbers of AofA. This implies that police showing up earlier reduces the total trauma.

Heat maps for the total number of AofA perpetrated by the police in a and protesters in b. The parameters used are \(\tau _c = 5\), \(v_c =15,\;T_1=.1\) and \(T_2=.001.\)
Note that we have taken \(T_1=.1\) for the simulations that produced the heat maps illustrated in Fig. 9. We can think of \(T_1\) as a parameter that modulates the effects of deterrence of AofA by the police presence versus that of procedural justice. We can compare these results to those seen in Fig. 10 where all things are equal with the exception that \(T_1=.01.\) In this case, the deterrence effect is much stronger than in the one seen in Fig. 9. The patterns observed are the same; however, we do note a shift to the upper right. Specifically, in Fig. 10a we see that there is more wiggle room for mitigating police AofA in terms of the entrance time of the police. When \(T=.1\) and the initial number of disruptive demonstrators was 500, the entrance time did not matter as the same number of AofA occur independently of when the police arrived. On the other hand, when \(T=.01\) the police entrance time can be a little bit delayed without increasing the number of AofA by the police.

The number of acts of aggression perpetrated by the a police and b protesters as a function of the initial total number of disruptive demonstrators and police entrance times. The parameters used for all simulations are \(\tau _c = 5\), \(v_c =15,\;T_1=.01\) and \(T_2=.001.\)
Finally, Fig. 11 illustrates the case when \(T_1=.5,\) which leads to a case where the procedural justice effect is much stronger than the deterrence effect of police presence. As expected, this leads to a larger region of parameters that lead to a significant number of AofA committed by the police, see Fig. 11a. Moreover, we see that the region with the maximum number of AofA committed by the protesters (top right corner - in bright yellow) is stretched downwards significantly. Naturally, the number of AofA committed by protesters is much larger.

The number of acts of aggression perpetrated by the a police and b protesters as a function of the initial total number of disruptive demonstrators and police entrance times. The parameters used for all simulations are \(\tau _c = 5\), \(v_c =15,\;T_1=.5\) and \(T_2=.001.\)
Discussion and conclusions
In this study, we adopted a twofold approach to explore the impact of different police protest management models on the evolution of protests. Our main focus was to understand how these models affect trauma, which may arise from various factors, including violence instigated by both protesters and police, as well as arrests. To achieve this, we employed a statistical analysis using event data sourced from ACLED.nnThrough our time series analysis, we made intriguing observations regarding the utilization of kinetic impact projectiles (KIPs). We found that the usage of KIPs is linked to an escalation in the number of protests in the subsequent days. Moreover, it was evident that the deployment of KIPs is associated with an increase in the number of fatalities in the following days. Surprisingly, the use of KIPs emerged as a more accurate predictor of deaths than simply considering the number of protests.
Our work supports the widely held notion that law enforcement should employ the least amount of force required to achieve their objectives and anything beyond that constitutes excessive force. Based on our findings, we contend that KIPs do not align with the principle of using the minimum force necessary. Even in situations where “less-lethal” tactics are deemed necessary, KIPs should be avoided as they prove more detrimental than other available “less-lethal” alternatives. Nevertheless, it is important to recognize the constraints inherent in our statistical analysis due to data limitations. First, even though the data sourced from ACLED stands as the most comprehensive available, it does not encompass the entirety of instances. Given that it draws from news sources, certain protests might go unnoticed and consequently unrecorded within the ACLED database. This limitation underscores the necessity for prudent interpretation of the findings. Secondly, the ACLED database simplifies the classification of kinetic impact projectiles (KIPs) into a binary framework (used or not used), neglecting to differentiate between various types like rubber bullets, pellets, or bean bag rounds. A more meticulous examination of KIPs might unveil distinct contexts where their application could be deemed justifiable.
The primary insight gained from our dynamic modeling approach underscores the criticality of comprehending crowd heterogeneity. Whether it’s an aggressive management strategy, an unintentional act of police aggression, or the nature of the crowd itself, these factors can all contribute to an escalation of trauma. Specifically, a peaceful crowd tends to result in no trauma and reduced social tension. However, an inadequate police response can lead to significant trauma.
Our conclusion is that the negotiated management model consistently proves to be a superior approach, irrespective of the type of crowd involved. In fact, the more prone the crowd is to acts of aggression, the more important it becomes for the police to be tolerant of such behavior. This approach can significantly decrease overall group trauma. Another noteworthy finding is that when a crowd contains disruptive demonstrators, a police presence can help reduce total trauma, provided the right policing strategy is employed. However, early police presence combined with a low threshold for violence may exacerbate trauma levels.
The dynamical approach utilized in this study relies on a mathematical framework based on modern theories of compliance and deterrence, as well as crowd psychology. Given the limited availability of comprehensive data on police influence over protester behavior and trauma, this framework proves particularly valuable. It allows us to quantify the group trauma experienced during protests based on police actions. The results presented are semi-quantitative, as we cannot precisely determine the parameter regime of specific events. We emphasize the urgent need for the police to collect detailed and comprehensive data, which will enable us to obtain quantitative results that can be rigorously verified. Such data availability and analysis are crucial for advancing our understanding of protest dynamics and their impacts.
Availability of data and materials
All data can be found https://www.overleaf.com/read/ymwxjpjrjypy
References
Artemov, G., Aleinikov, A., Daur, A., Pinkevich, A., & Abalian, A (2017) Social tension: the possibility of conflict diagnosis (on the example of st. petersburg). Economics & Sociology, 10:192–208, 06
Berenji, B., Chou, T., & D’Orsogna, M. (2014). Recidivism and rehabilitation of criminal offenders: A carrot and stick evolutionary game. PLoS ONE, 9(1), e85531.
Berestycki, H., & Nadal, J.-P. (2010). Self-organised critical hot spots of criminal activity. European Journal of Applied Mathematics, 21(4–5), 371–399.
Berestycki, H., Nadal, J.-P., & Rodríguez, N. (2015). A model of riot dynamics: Shocks, diffusion, and thresholds. Networks and Heterogeneous Media, 10(3), 1–34.
Bloom, M. (2020). Far-right infiltrators and agitators in george floyd protests: Indicators of white supremacists. Just Security. Reiss Center on Law and Security. New York University School of Law.
Bonnasse-Gahot, L., Berestycki, H., Depuiset, M. A., Gordon, M. B., Roché, S., Rodriguez, N., & Nadal, J. P. (2018). Epidemiological modelling of the 2005 French riots: A spreading wave and the role of contagion. Scientific Reports, 8(1), 1–20.
Braha, D. (2012). Global civil unrest: Contagion, self-organization, and prediction. PLoS ONE, 7(10), 1–9.
Burbeck, S. L., Raine, W. J., & Stark, M. J. A. (1978). The dynamics of riot growth: An epidemiological approach. The Journal of Mathematical Sociology, 6, 1–22.
Bykovsky, V. A. (2008). Social’naya napryazhennost’ i trevozhnost’ v kontekste diagnostiki obshchestvennyh konfliktov (social tension and anxiety in the context of the diagnosis of social conflicts). Marketing, 3, 169–176.
Cosner, L. (1956). The function of social conflict. The Free Press.
Davies, T. P., Fry, H. M., Wilson, A. G., & Bishop, S. R. (2013). A mathematical model of the London riots and their policing. Scientific Reports, 3(1303), 1–9.
Delehanty, C., Mewhirter, J., Welch, R., & Wilks, J. (2017). Militarization and police violence: The case of the 1033 program. Research & Politics, 4(2), 2053168017712885.
della Porta, D., & Reiter, H. (1998). Policing protest: The control of mass demonstrations in western democracies (New, Vol. 6). University of Minnesota Press.
Drury, J., & Reicher, S. (1999). The intergroup dynamics of collective empowerment: Substantiating the social identity model of crowd behavior. Group Processes and Intergroup Relations, 2(4), 381–402.
Drury, J., & Reicher, S. (2000). Collective action and psychological change: The emergence of new social identities. British Journal of Social Psychology, 39(4), 579–604.
Earl, J., & Soule, S. A. (2010). The impacts of repression: The effect of police presence and action on subsequent protest rates. Research in social movements, conflicts and change (Vol. 30, pp. 75–113). Emerald Group Publishing Limited.
First, J. M., Danforth, L., Frisby, C. M., Warner, B. R., Ferguson, M. W., Jr., & Houston, J. B. (2020). Posttraumatic stress related to the killing of Michael brown and resulting civil unrest in Ferguson, Missouri: Roles of protest engagement, media use, race, and resilience. Journal of the Society for Social Work and Research, 11(3), 369–391.
I. for Intergovernmental Research. After-action assessment of the police response to the. (August 2014). demonstrations in Ferguson, Missouri (p. 2015). Technical Report August, COPS Office Critical Response Initiative, Washington DC: Office of Community Oriented Policing Services.
Galovski, T., Peterson, Z., Beagley, M., Strasshofer, D., Held, P., & Fletcher, T. (2016). Exposure to violence during Ferguson protests: Mental health effects for law enforcement and community members. Journal of Traumatic Stress, 29(4), 283–292. https://doi.org/10.1002/jts.22105
Gurr, T. (1951). Why men Rebel. Princeton University Press.
Haar, R., Iacopino, V., Ranadive, N., Dandu, M., & Weiser, S. (2017). Death, injury and disability from kinetic impact projectiles in crowd-control settings: A systematic review. BMJ Open, 7(12), 1–9.
Haar, R., Iacopino, V., Ranadive, N., Weiser, S. D., & Dandu, M. (2017). Health impacts of chemical irritants used for crowd control: A systematic review of the injuries and deaths caused by tear gas and pepper spray. BMC Public Health, 17(1), 2020–2022.
Hinds, L., & Murphy, K. (2007). Public satisfaction with police: Using procedural justice to improve police legitimacy. The Australian and New Zealand Journal of Criminology, 40(1), 27–42.
Hoggs, M (2016) Understanding peace and conflict through social identity theory. In: Social identity theory, chapter understand. Peace Psychology Book Series. . pp. 3–17
Koulisis, N., Satija, C., Hou, J., & et al (November 2021) Ocular trauma and death during the protests and riots of 2020: decision analysis informed by data and dynamic mathematical modeling. In: The American academy of ophthalmology 2021 annual meeting.
Lang, J., & De Sterck, H. (2014). The Arab Spring: A simple compartmental model for the dynamics of a revolution. Mathematical Social Sciences, 69, 12–21.
Lebron, C. J. (2017). The making of black lives matter: A brief history of an idea. Oxford University Press.
Maguire, E. R. (2015). New directions in protest policing. Saint Louis University Public Law Review, 35(1), 67.
Marples, D., & Mills, F. (2015). Ukraine’s Euromaidan: Analyses of a civil revolution. Ibidem Verlag.
Mazerolle, L., Bennett, S., Davis, J., Sargeant, E., & Manning, M. (2013). Procedural justice and police legitimacy: A systematic review of the research evidence. Journal of Experimental Criminology, 9(3), 245–274.
Ni, M. Y., Kim, Y., McDowell, I., Wong, S., Qiu, H., Wong, I., Galea, S., & Leung, G. (2020). Mental health during and after protests, riots and revolutions: A systematic review. Australian and New Zealand Journal of Psychiatry, 54(3), 232–243.
Nicoara, O., & White, D. (2016). A contextual model of the secessionist rebellion in eastern ukraine. arXiv preprint arXiv:1606.02748
Orru, M. (1983). The ethics of anomie: Jean marie guyau and emile durkheim. The British Journal of Sociology, 34(4), 499–518.
Parson, T. (1951). The social system. Free Press.
Paternoster, R. (2010). How much do we really know about criminal deterrence? Journal of Criminal Law and Criminology, 100(3), 765–824.
Raleigh, C., Linke, A., Hegre, H., & Karlsen, J. (2010). Introducing acled: An armed conflict location and event dataset: Special data feature. Journal of Peace Research, 45(7), 651–660.
Rogers, K. L. (1988). Oral history and the history of the civil rights movement. The Journal of American History, 75(2), 567–576.
Schweitzer, F., & Holyst, J. A. (2000). Modelling collective opinion formation by means of active Brownian particles. The European Physical Journal B, 15, 723–732.
Short, M. B., D’Orsogna, M. R., Pasour, V. B., Tita, G. E., Brantingham, P. J., Bertozzi, A., & Chayes, L. B. (2008). A statistical model of criminal behavior. Mathematical Models and Methods in Applied Sciences, 18(Suppl.), 1249–1267.
Shumway, R. H., & Stoffer, D. S. (2017). Time series analysis and its applications (4th ed.). Springer.
Smelser, N. (1994). Sociologiya (Sociology). Phoenix.
Galovski TE, Peterson ZD, Beagley MC, Strasshofer DR, Held P, Fletcher TD. (2016). Exposure to Violence During Ferguson Protests: Mental Health Effects for Law Enforcement and Community Members. J Trauma Stress. 2016;29(4):283-92. https://doi.org/10.1002/jts.22105. Epub 2016 Jun 2. PMID: 27254474.
Tyler, T. R. (2006). Why people obey the law. Princeton University Press.
U. S. D. of Justice. Office of Community Oriented Policing Services and I. for Intergovernmental Research (US). After-action assessment of the police response to the. (August 2014). demonstrations in Ferguson (p. 2015). Department of Justice, Office of Community Oriented Policing Services: Missouri.
Velut, J.-B. (2020). A tale of polarizations: Stress, inertia and social change in the New Gilded Age. In: Democracy participation and contestation. pp. 127–142.
Wolfe, S., Nix, J., Kaminski, R., & Rojek, J. (2016). Is the effect of procedural justice on police legitimacy invariant? Testing the generality of procedural justice and competing antecedents of legitimacy. Journal of Quantitative Criminology, 32(2), 253–282.
Acknowledgements
We are grateful to the Institute for Computational and Experimental Research in Mathematics (ICERM) where this project was begun as part of a program on Data Science and Social Justice. We also want to thank the ACLED team for making these data publicly available. We would like to thank Drs. Nicole Koulisis and Stavros Moysidis for motivating this work.
Funding
This work was partially funded by Directorate for Mathematical and Physical Sciences (NSF-DMS 2042413) and AFOSR MURI Grant Number FA9550-22-1-0380
Author information
Authors and Affiliations
Contributions
All authors contributed to the analysis of the models and writing of the manuscript. All authors read and approved the final manuscript.
Corresponding author
Ethics declarations
Competing interests
The authors declare that they have no competing interests.
Additional information
Publisher's Note
Springer Nature remains neutral with regard to jurisdictional claims in published maps and institutional affiliations.
Rights and permissions
Open Access This article is licensed under a Creative Commons Attribution 4.0 International License, which permits use, sharing, adaptation, distribution and reproduction in any medium or format, as long as you give appropriate credit to the original author(s) and the source, provide a link to the Creative Commons licence, and indicate if changes were made. The images or other third party material in this article are included in the article’s Creative Commons licence, unless indicated otherwise in a credit line to the material. If material is not included in the article’s Creative Commons licence and your intended use is not permitted by statutory regulation or exceeds the permitted use, you will need to obtain permission directly from the copyright holder. To view a copy of this licence, visit http://creativecommons.org/licenses/by/4.0/. The Creative Commons Public Domain Dedication waiver (http://creativecommons.org/publicdomain/zero/1.0/) applies to the data made available in this article, unless otherwise stated in a credit line to the data.
About this article

Cite this article
Rodríguez, N., White, D. An analysis of protesting activity and trauma through mathematical and statistical models. Crime Sci 12, 17 (2023). https://doi.org/10.1186/s40163-023-00197-0
Received:
Accepted:
Published:
DOI: https://doi.org/10.1186/s40163-023-00197-0