- Research
- Open access
- Published:
Unpacking the police patrol shift: observations and complications of “electronically” riding along with police
Crime Science volume 11, Article number: 15 (2022)
Abstract
As frontline responders, patrol officers exist at the core of policing. Little remains known, however, about the specific and nuanced work of contemporary patrol officers and their shift characteristics. Drawing upon computer-aided dispatch (CAD) data for a random sample of 60 patrol shifts, we empirically analyse the activities of patrol officers working in a Canadian police agency. Our analyses reveal several interesting findings regarding the activities of patrol officers, the nature and prevalence of calls for service attended by such officers, and the temporal patterns of different patrol shifts. We discuss our results with respect to both criminological research as well as policing practice. We also highlight the complications and implications of using electronic police records to empirically study officer activity.
Introduction
As a core pillar of the criminal justice system, the police have existed at the forefront of scholarly and public attention for decades. Given the implications of their work, such interest is well-justified. From a scholarly perspective, the police are highly visible representatives of the criminal justice system and related to both social and crime control. From a practical perspective, the police impact the lives of people and the safety of communities. Not all entities within the policing institution, however, are equally implicated in these matters. Most salient among these discussions are the patrol officers: the uniformed, public-facing, and frontline personnel responsible for conducting the voluminous, street-level work of police. Yet, despite this importance, the nuance of patrol work has arguably received less empirical attention than some related topics, such as the structure of police organisations and the effects of police on crime. Considering the diverse role of police (e.g., Bittner, 1967; Lum et al., 2021; Thacher, 2022; Wilson, 1968), it is critical that research tackles the pressing questions of what patrol officers do, when, and for how long to then inform related conversations about their work.
To contribute to this aim, we draw upon computer-aided dispatch (CAD) data for a random sample of 60 patrol shifts to explore the practices of patrol officers working in a Canadian police agency. Our observations present a more mundane and nuanced depiction of policing than sometimes presented in public narratives. Handling calls for service, most of which are classified as low priority and not crime-related, comprises only a modest proportion of officers’ time on patrol. Other activities include being available to handle calls for service, working from headquarters, engaging in meal breaks, and completing administrative and other operational tasks. Given the reliance of modern police on electronic data to map and assess their practices, our use of these data to observe patrol officers exhibits wide, international relevance. We discuss such relevance in light of its practical considerations and methodological implications.
Background
The role of the patrol officer
Patrol officers are the backbone of police. They comprise the largest proportion of all officers in many police agencies. As frontline responders, they are directly responsible for responding to calls for service, including emergencies and non-emergencies, and investigating crime. In less direct capacities, they are tasked with representing the institution through their uniformed presence, preventing crime, and engaging in the additional tasks of police, like managing fear, providing social service referrals, and confirming the welfare of people. The consequences of the work of patrol officers is significant. Nearly all public-police interactions and crime investigations start at the patrol-level, and the activities and decisions of even the most junior patrol officer exhibit the potential to shape the trajectory of an entire event and the outcomes for all affected people. The ability for patrol officers to effectively balance their responsibilities, including for reactive and proactive policing, can also impact a whole sleuth of policing outcomes, from response times to crime rates to clearance rates.
Research has long argued that much police work does not regard crime, but rather social order and peacekeeping functions (e.g., Bittner, 1967; Wilson, 1968). Consistent with this argument, recent research that explored police calls for service from across the United States found that “traffic-related problems, everyday disputes, worries of suspicious behaviors, disorders, disturbances, and general requests for help and assurance” comprised the majority of calls for which officers are dispatched (Lum et al., 2021, p. 17; also see Simpson & Orosco, 2021). If patrol officers are handling these calls, then it would suggest that their work is diverse as a function of these diverse requests. But patrol work is not only about handling calls for service.
Many crime control efforts are directly implicated in the work of patrol officers. For example, hot spot policing, of which has been the subject of enormous scholarly attention (Braga et al., 2019), most often involves patrol officers spending time patrolling high crime areas referred to as “hot spots.” As one case in point, Koper (1995) argued that the optimal length for patrol stops is 11 to 15 min (also see Telep et al., 2014). Other kinds of proactive police work, including traffic-related enforcement, also typically falls upon the shoulders of patrol officers, who sometimes engage in traffic stops when not handling calls for service (Wu & Lum, 2020). A similar logic can be presented for proactive drug- and weapons-related enforcement as well, which frequently manifest in the form of officer-initiated stops (White & Fradella, 2016).
Exploring the effects of these different activities falls outside the scope of this article. However, the fact that patrol officers, whose work can be fluid and dynamic, are often tasked with engaging in these activities as well as handling calls for service implies that they must manage their time in a way that allows for competing demands to be addressed. This is especially the case when performance metrics for patrol officers include both reactive and proactive policing outputs. As generalists, patrol officers must not only exhibit some competency in most areas, but also must be available to complete many different tasks.
Measuring the work of patrol officers
Assessing the activities of patrol officers is no easy feat. Although much patrol work is public, insofar that it is frequently conducted in public spaces and in the purview of members of the public, it is not necessarily accessible, at least from an empirical perspective. To fully understand the work of patrol officers, one must observe the work of such officers: not just at a single call for service, not just for a few hours, but for an extended period of time and at different times.
Researchers tackling patrol-related questions have largely employed two approaches. First, is the ethnographic or field study approach that has placed researchers in the seat of patrol cars (e.g., Famega et al., 2005; Parks et al., 1999; Sierra-Arevalo, 2021; Todak & James, 2018). By physically riding alongFootnote 1 with police, researchers are able to manually observe the work of patrol officers and its intricacies in tremendous detail. Second, is the secondary data approach that has situated researchers at the epicentre of police records (e.g., Simpson & Hipp, 2019; Webster, 1970; Wu & Lum, 2017). By post hoc assessing the activities of patrol officers via secondary data, researchers are able to assess patterns in public demands on police as well as the activities of officers. For example, researchers can assess the frequency of different call-types and their dispositions as well as the number of some proactive activities conducted by patrol officers.
Like all research methods, each of these approaches presents benefits and weaknesses. Whereas field research may provide a richer and more holistic assessment of the practical work of patrol officers, it can be time-intensive and costly, which can limit the number of shifts that can be reasonably observed. It can also present the risk of reactivity, whereby officers change their activity as a function of being monitored. Whereas secondary data analyses offer a greater ability to compile larger volumes of data over longer periods of time, at lesser costs, and without concerns about reactivity, secondary data generally do not offer a comparable depth of information about individual officers or their shifts. Because of data limitations, including privacy concerns if the data are publicly available, these typically quantitative examinations are frequently conducted in the abstract: researchers are often forced to study macro-level trends as opposed to more micro-level behaviours. For example, researchers may quantify the number of traffic stops conducted or types of calls for service attended during a day/week/month/year, but may not be able to disentangle how many stops were conducted and how many calls were attended by how many different individual officers and in the context of which specific shifts.
As part of the present research, we supplement existing literature by employing more of a hybrid approach to “electronically” ride-along with police for a random sample of 60 patrol shifts. Specifically, we pose the following questions: (1) How can CAD data be leveraged to measure the activities of patrol officers?; (2) What do CAD data suggest about the activities of patrol officers in terms of substance and time?; and (3) What are the challenges of using CAD data for research purposes and how might such challenges inform future researchers’ use of these data? As we outline below, the data that we draw upon and the analyses that we conduct are rich in volume and nuance. We also focus on the shift as our unit of analysis. By testing these questions at this unit using these data, we are able to provide a comprehensive snapshot of patrol officer activity as well as highlight the methodological implications of using electronic records to study patrol work. These contributions are especially important given the salience of current debates surrounding policing and how the work of patrol officers could, should, or ought to look in an era of reform.
Methodology
Setting
The present research draws upon data from a municipal police agency in Western Canada. This agency provides policing services for a population of approximately 45,000 full-time residents. It is dispatched by a consolidated call-centre that is staffed by trained, non-sworn employees who handle police-related calls for multiple cities in the region. Its urban jurisdiction covers a variety of different geographies and land-uses and has a median household income above the national average. Its crime rate falls below the national average.
Data
The present research explores patrol officer records electronically collected via the CAD system of the police agency under study. In lieu of analysing shift logs for all officers for all possible patrol shifts, which would be neither practical nor necessary, we analyse a random sample of 60 patrol shifts associated with 28 different officers from 2019.Footnote 2 The variation in the number of shifts per officer was the result of our below described sampling strategy and the finite number of officers assigned to the patrol section.
Standard patrol shifts at this police agency are 12 h long and subdivided by time of day. The regularly scheduled “day shift” commences at 7:00am and the regularly scheduled “night shift” commences at 7:00 pm. All patrol officers work a four shift rotation, whereby they complete two day shifts followed by two night shifts before receiving four rest days. As a function of this shift pattern, each patrol officer works across different times and days of the week each week. All officers patrol alone at this agency, with one officer per vehicle (unless training).
In order to ensure that we represented all shift times, days of the week, and months of the year in our sample, we employed a stratified random sampling strategy to select our shifts. First, we randomly sampled three weekday (i.e., Monday–Thursday) and two weekend (i.e., Friday–Sunday) dates within each month. Next, we randomly selected shift times for each identified date, ensuring that we retained at least one day shift and one night shift for both weekday and weekend dates within each month. Finally, we randomly sampled an officer for each identified shift whose electronic data we then compiled. Because our unit of analysis is the shift, we did not consider officer particulars as part of our sampling process. See Table 1 for a summary of our sample of shifts.
Shift logs and status codes
Each shift log began when the patrol officer signed into the CAD system and concluded when they signed out of the CAD system. While signed into the CAD system, all documentedFootnote 3 activities of the officer were electronically recorded in the form of two-digit status codes. These status codes are generated by officers via their in-car computers and/or dispatchers via their dispatch software. For example, an officer can use their in-car computer to mark themselves at their headquarters (“HQ”). An officer can also use their in-car computer to mark themselves as conducting a foot patrol (“FP”) or roadblock (“RB”). Dispatchers, namely those working in the capacity of radio-operators, can also update status codes on behalf of officers (e.g., see Simpson, 2021). For example, dispatchers can mark officers as available (“IS”), engaged in a traffic or person stop (“TS” or “PS,” respectively), or providing cover for another officer (“CU”), among others.
Given that status codes reflect the type of activity that a patrol officer is engaged in at any documented point in time (at least in a rudimentary form), we can use them as a measure of officer activity. Moreover, given that updates to officers’ status codes are date- and time-stamped within the CAD system, analysing them and their textual remarks allows us to post hoc estimate the amount of time that officers spent on each activity. For example, if the shift log indicates that the officer conducted a person stop (“PS”) at 1:05 pm and then initiated a meal break (“62”) at 1:09 pm, we would estimate that the officer spent four minutes on the person stop. Similarly, if the shift log indicated that the officer initiated a roadblock (“RB”) at 11:03 pm and then became available (“IS”) at 11:43 pm, we would estimate that the officer spent 40 min at the roadblock.
In their raw form, patrol officers used a total of 23 different status codes during our sample of shifts. With that being said, many status codes are similar in substance and therefore we grouped them into broader categories that effectively captured their shared theme. For example, we grouped all status codes related to calls for service into the shared category of “calls” and all status codes related to administrative tasks into the shared category of “administration.” This resulted in a final list of eight different status code categories, which we retained for our analyses (see Table 2).
In addition to the date and time, status codes also provide information about the call-type of a call for service that a patrol officer has been assigned if their status code changes while electronically attached to a call. Exploring the types of calls for service that patrol officers respond is of much empirical interest, and, therefore, we use this information to estimate the prevalence and demands of different call-types. We recognise, however, that call-type classifications are not without their limitations. As argued by Simpson and Orosco (2021), calls for service data can exhibit at least some measurement error. Not only is the information initially provided by callers to dispatchers often ambiguous and nebulous, but the public’s reasons for requesting police can be complex and dynamic, making the process of classifying events into specific call-types difficult (Simpson & Orosco, 2021). Further complicating such process is the fact that calls can change over their lifespan as new information is brought to the attention of police, which can lead to changes in classifications over time (Simpson & Orosco, 2021). This applies to service-oriented requests as well. As one case in point, Pearce and Simpson (2022) observed that requests for police to conduct wellness checks are not always initially classified as the expected “Check Well-Being” call-type (a similar finding was observed by Ratcliffe (2021) for public health calls more broadly). If calls are not accurately classified and/or updated in the CAD system, then relying upon such classifications to interpret the nature of calls could present challenges.
Results
Observations from “electronically” riding along with police
In this first section of results, we describe the activities of patrol officers and their temporal patterns. Consistent with the police agency’s mandate, the average duration of shifts in our sample (as recorded by the CAD system) was 11.5 h. The shortest shift in our sample had a duration of approximately four hours and the longest shift had a duration of roughly 15.5 h. Shorter shifts were often a function of officers’ pre-scheduled leave, including for vacation and/or administrative functions, like the need to attend court in the morning immediately following a night shift. In contrast, longer shifts were typically the result of unanticipated needs, including handling high priority calls for service at the end of the shift. Rather than use raw minutes engaged in different activities as part of our analyses, which would not account for this variation in the active amount of time on duty, we thus use percentages to assess the amount of time that officers engaged in different activities: (minactivity / minshift)*100. See Fig. 1 for a depiction of activities by shift.
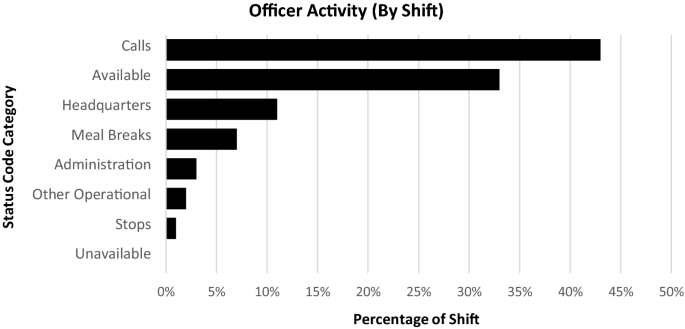
Percentage of patrol shift engaged in different activities (by shift)
At an aggregate level, patrol officers handledFootnote 4 354 different calls for service of 55 different call-types during our sample of shifts. Of such calls, more regarded non-crime than crime-related call-types. In fact, the most frequently occurring call-types included: “Alarm” (11%), “Suspicious Person” (7%), and “Abandoned 911” (6%). Of the calls for service in our sample, 12% were assigned the highest priority level of 1, 26% were assigned the mid-level priority of 2, and the remaining 62% were assigned the lowest priority levels of 3 or 4. These findings indicate that much patrol work may be mundane, insofar that it does not involve the kinds of action and thrill traditionally depicted in policing media (e.g., see Maurantonio, 2012). Across our sample, officers were electronically attached to calls for service for a total of 292 h. The average duration of calls for service from initial dispatch to closure in the CAD systemFootnote 5 was 50 min.
At an individual level, patrol officers handled an average of six calls for service during each shift, with a minimum of one call and a maximum of 12 calls. However, as we discuss below, not all calls require equal investments from officers. For example, some calls are concluded faster than others because they do not result in criminal charges (e.g., for a bylaw complaint). Sometimes calls are also cancelled before officers arrive on-scene, if, for example, the problem in question resolves itself without officer attendance (e.g., for a hazardous complaint). And, other times, a suspect may not be located once an officer arrives on-scene (e.g., for a suspicious person complaint). Consistent with such logic, the amount of time that officers spent electronically attached to calls for service during their shift ranged from as low as 15 min to as high as 579 min. Moreover, calls for service which required more time frequently involved crimes, typically because they required more formal investigation and associated report writing. Within the crime context, calls related to violent crimes averaged longer durations than those related to property crimes. Although we recognise that measurement error exists in call-type classifications (as discussed earlier; Simpson & Orosco, 2021), and therefore they must be interpreted with some caution, differences in durations indicate that different calls for service may require different levels of investment by officers. See Table 3 for a summary of call-type demands by prevalence and duration for the top 10 most frequently occurring call-types attended by officers during our sample of shifts.
As outlined above, the raw amount of time spent handling calls for service may not always be an ideal measure of the demand of such calls on patrol officers. Given that shift durations can vary, the percentage of time spent electronically attached to calls for service during the shift may be a more helpful measure. On average, patrol officers spent approximately 45% of their shift electronically attached to calls for service on day shifts and 41% on night shifts. Of such time, most was spent while the officer was marked as on-scene at calls, although we discuss the challenges of using different status codes as they pertain specifically to call handling below. These results imply two conclusions. First, only a modest proportion of an officer’s shift appears to be spent actively handling calls for service. This infers that officers spend their remaining time on other activities. Second, some variation may exist with respect to the amount of time spent handling calls for service as a function of shift. This underscores the importance of time in understanding patrol work: riding along with police during the day may produce a different image of patrol work than riding along with police during the night.
Other activities
The observation that patrol officers generally spent less than half of their shift handling calls for service begs questions about their other activities. As shown in Table 4, the average patrol shift is comprised of many different activities that are not specifically related to call handling.
During day shifts, patrol officers were recorded as being available, on average, for approximately 27% of their shift. Although we cannot confirm the specifics of what officers physically did during such available time (a point that we revisit later), we assume based on operational experience that much of this time was spent conducting routine preventive patrols. On average, officers conducted one traffic or person stop per day shift (with a range of zero to five stops), which comprised approximately 1% of their shift time. Officers also spent approximately 4% of their day shift engaged in administrative duties and 2% engaged in other operational activities, like conducting foot patrols, roadblocks, and/or directed enforcement. On average, officers spent approximately 13% of their day shift working at their headquarters and 8% engaged in meal breaks. Finally, officers conducted an average of 20 vehicle license plate queries via their in-car computers (a proxy for police proactivity), with a minimum of zero and a maximum of 122 queries.
During night shifts, patrol officers were recorded as being available, on average, for approximately 38% of their shift. Officers spent approximately 3% of their night shift engaged in administrative duties, 2% on other operational activities, and 8% working at their headquarters. Officers also spent approximately 6% of their night shift engaged in meal breaks. In terms of proactivity, officers conducted an average of one traffic or person stop per night shift, which comprised approximately 2% of their shift time. Officers also conducted an average of 13 vehicle license plates queries via their in-car computers during night shifts.
We observed few obvious differences between weekday and weekend shifts among our sample. For example, we found similar patterns in the number of activities during shifts, the number of calls for service handled during shifts, and the priority levels of such calls (although there were proportionally greater numbers of calls classified as the “Alarm” call-type on weekdays and the “Assist General Public” call-type on weekends). We also found similar patterns in how patrol officers spent their time during shifts, with the exception of time spent handling calls, which appeared to be greater on weekends. Finally, we found that officers conducted more license plate queries, on average, on weekends than weekdays.
Patterns of activities among shifts
As described above, the average patrol shift is comprised of many different activities. Not only do patrol officers engage in different activities during their shifts, but they also frequently engage in such activities during different parts of the shift. For example, officers always began their shifts at their headquarters. In many instances, and when call volume allowed, officers then engaged in a meal break, often in the form of coffee with their colleagues. In roughly 40% of instances, an officer’s meal break was immediately followed by their response to their first call for service of the shift. During peak hours, and following clearance of each call for service, officers normally became available for only a short period of time before being dispatched to another call.Footnote 6 However, during non-peak hours, and especially during night shifts, officers were frequently recorded as being available for prolonged periods of time before status code changes.Footnote 7 During night shifts, officers also frequently engaged in a final meal break immediately before the conclusion of their shift, typically in the form of a visit to a local cafe.
At a more micro-level, changes in patrol officers’ activities were generally consistent with the linear nature of police work. For example, officers were normally dispatched to a call for service before being marked as enroute to such call and then eventually on-scene at that call. Proactive activities, like conducting traffic or person stops, were generally followed by indication that the officer was available again for a call for service. Officers also always terminated their shift with the unavailable status code. In this way, status codes can offer an interesting alternative to observing the activities of officers, albeit with limits, without needing to physically ride-along with them and manually record their activities.
Finally, different shifts across our sample exhibited different levels of activity. Whereas some shifts had a plethora of different activities, other shifts had very few activities. Indeed, the range of activities recorded across our sample of shifts was 11 to 59 activities, with an average of 29 activities. Day shifts generally exhibited more activities than night shifts. With that being said, this variation in volume could be the result of many different factors, most of which we are unable to empirically assess as part of our research. For example, sometimes the number of activities may be a function of the officer working the shift: some patrol officers are simply more active than others and/or more accurately document their activities. Other times, the number of activities may be the result of organisational priorities. Depending upon calendaring and workflow, a shift may be dedicated almost entirely to report writing if an officer must catch-up on their work queue and/or complete overdue assignments. In other circumstances, the number of activities may be a consequence of the policing environment during that specific shift. Police activity varies as a function of people, and sometimes people proactively seek out less from the police and/or fewer people are active in the city, which in turn can limit the number of activities that officers could reasonably engage in during the shift.
Complications of “electronically” riding along with police
The shift logs produced by the CAD data provided much insight into the work of patrol officers. Such insight, however, was not without its complications. These electronic police records presented many challenges for both use and interpretation, which are relevant to past and future use of these data in research. In this second section of results, we thus describe these challenges and their relevance for the use of these data for assessing research questions of an applied nature.
First, although comprehensive, two-digit status codes alone in their raw form did not always present a nuanced picture of an officer’s activity. In some instances, additional remarks that accompanied such codes were necessary to obtain clarity. For example, an officer may accompany the on-scene status code with textual remarks about making a phone call to the complainant, which would indicate that they were metaphorically on-scene rather than physically on-scene. Officers may also use the same status codes to refer to multiple different activities, including for activities with their own status codes. For example, officers may use the status code for enforcement to describe their roadblock, which technically has its own status code. Officers may also engage in various definable activities while marked at headquarters, including report writing for previously handled calls for service, which too have their own status codes.
Second, apparent changes in patrol officer activities were sometimes the result of technological implications of different status codes rather than practical changes in officer activity. For example, if while electronically attached to a traffic-related call for service, an officer conducted a stop on the subject vehicle, and the radio-operator used the traffic stop status code to indicate such stop, then the officer would be electronically detached from the associated call for service. The shift log for such officer would therefore appear much more truncated than it was in reality: it would appear as if the officer was handling a call for service only to be cleared from such call for a traffic stop to then be again dispatched to that call following that stop, when theoretically the traffic stop was a part of the call.
Third, and relatedly, officers may sometimes conduct activities without formally changing their status code to document such activities. For example, officers may attend a colleague’s call for service without electronically attaching themselves to that call or even forget to denote themselves on-scene at their own call. This speaks to the broader issue of assessing the exact number of officers present at an event at any specific time, of which there is little ability to do using this kind of methodological approach. Relatedly, an officer may speak to a pedestrian about their concern while still recorded at the scene of an unrelated call for service. Lastly, officers may engage in activities even while listed as being available, like eating, if they believe that they could be reasonably cleared from the activity to handle a call for service if dispatched. From this perspective, it is particularly challenging to interpret the available status code because it could represent so many different practical things: “being available” is not necessarily synonymous with “doing nothing,” but potentially doing something undocumented. These complications of assessing unassigned time are consistent with the findings of Famega et al. (2005), who studied patrol officer activities in Baltimore, Maryland roughly two decades ago.
Less of a complication, but more of an interpretational side-effect, these data also provide a glimpse into the complicated work of radio-operators. Given that many status code updates are completed by radio-operators, examining the nature of status code changes provides insight into the activities of radio-operators and the diversity among their styles of dispatching (e.g., see Simpson, 2021). For example, under ideal circumstances, officers should have a dispatched, enroute, and on-scene status code change for each call for service that they handle. However, in many instances, this was not the case: typically because radio-operators initially dispatched officers using the status code for enroute, thereby providing no information about the temporal gap from when an officer was initially dispatched to the call and when they actually began travelling to that call. This illustrates why researchers should apply some caution when relying upon what has now sometimes become publicly available response time information for calls for service. In some cases, radio-operators also left officers electronically attached to their calls for service while such officers completed the associated reports, whereas in other cases, radio-operators electronically cleared officers from their calls in favour of a dedicated status code for report writing. These distinctions made it difficult to breakdown how much “on-scene time” was officers actively responding versus passively writing about the call for service in question.
Relatedly, radio-operators sometimes electronically cleared calls for service from the CAD system immediately after the officer departed the scene of such call, whereas other times they electronically “stacked” the call to the assigned officer so that they could be re-dispatched at a later point in their shift to complete the associated report. In these instances, the total time that the officer was electronically attached to the call varied. Moreover, in the case of the latter, the shift log made it appear that the officer was re-dispatched to the call for re-response at a later time, when in reality the second dispatch was simply so that the officer could write the associated report via their in-car computer. As noted in the preceding paragraph, this too complicated our ability to confidently assess the specific amount of time that officers spent report writing (and, hence, again our use of the term, “handling”).
Discussion
As part of the present research, we drew upon electronic records from a random sample of 60 patrol shifts to unpack the activities of patrol officers working in a Canadian police agency. Our results provide insight into the work of patrol officers and the implications of their work from both practical and scholarly perspectives. From a practical perspective, our findings speak to the diverse and complicated role of police. Consistent with related research, we find that officers handled largely low priority calls for service that most often did not regard crime. Calls for service averaged 50 min from initial dispatch to closure in the CAD system, and officers handled an average of six calls during each shift, indicating that they spent only a modest proportion of their shift handling calls. Given that much time during the shift was unaccounted for by call activity, unpacking the other activities of officers during their shifts, like available time as well as proactive and administrative duties, was important.
In terms of documented proactivity, we found that patrol officers generally initiated few traffic or person stops.Footnote 8 Most officers also conducted few license plate queries, a form of proactivity that often precedes a traffic stop. In this way, more patrol work appears to be citizen-initiated than officer-initiated. Considering the negative consequences that can result from proactive policing (e.g., see Epp et al., 2014), these findings may be lauded by some. Nonetheless, we acknowledge that officers likely engaged in other forms of proactive policing that did not have specific status codes, like routine preventive patrols (e.g., see Kelling et al., 1974), during their shifts (particularly during their time marked as available).Footnote 9
Finally, we found some temporal patterns in officers’ activities during their shifts. These findings may provide police leaders with greater awareness about the format and ordering of activities during shifts, which may allow for better estimates of work activity as well as opportunities to consider how patrol officers could best structure their time. They may also provide practical insight into how police agencies may manage their patrol sections and define their role within society. In order to have informed conversations about policing, all stakeholders must understand the full nature of the work, demands, and responsibilities of police as currently performed.
From a scholarly perspective, our analyses provide an interesting alternative to assessing the work of patrol officers that blends the benefits of different research methods. By re-constructing patrol officers’ activities using such detailed and descriptive electronic police records at the shift-level, we were able to tease apart nuance among a large sample of shifts with a degree of precision that is atypical for secondary data analysis. It would be extremely difficult, if not impossible, to physically ride-along with and record all patrol officers’ activities during all shifts at all times, especially in large police agencies. Yet, to understand the intricacies of the work of patrol officers, scholars and police leaders alike must know exactly what officers do during their shifts. Our approach offers a potential means to achieve such goal at a larger scale than traditionally explored. This approach may be especially attractive in light of modern police’s overwhelming reliance on CAD systems for operational policing.
We were also able to highlight the complications of using even such detailed records for research purposes. For example, patrol officers may conduct activities without formally updating their status code to document such activities or use an incorrect status code. Relatedly, even when an officer’s status code showed them as being available, they may still have engaged in otherwise definable work, which may have underestimated our measure of their workload. Certain changes in status codes also exhibited technological implications, which could have induced perceived changes in officer activities, as was the case for traffic stops. And, different styles of dispatching impacted the quality and accuracy of shift logs. Police data can present many analytical complications, and so from this perspective, we contribute to a growing body of literature that has explored the empirical use of such data (e.g., Haberman et al., 2022; Klinger & Bridges, 1997; Nesbary, 1998; Pearce & Simpson, 2022; Ratcliffe, 2021; Simpson & Orosco, 2021; Varano et al., 2009).
Limitations
Before proceeding to our conclusion, we highlight three limitations of our approach. First, although we analysed data from a large sample of patrol shifts, we recognise that all such shifts originated from a single police agency. For this reason, our findings may not generalise to all police agencies, including larger agencies, agencies in other geographic regions, and/or agencies which police cities with higher crime rates. Nonetheless, we note that our agency of study may be more similar to more police agencies in North America than the very large agencies that have been the focus of much historical research. Second, we did not conduct inferential analyses as part of our article. Given the novelty of our approach and the associated need to unpack our observations, we limited our scope to descriptive analyses. We acknowledge that it would be possible to use inferential analyses to test for differences among the kinds of output described in our article, which future researchers may wish to do. Third, in addition to the measurement error inherent in some status code activities, we also could not account for work completed while patrol officers were not signed into the CAD system, which could have been at the very beginning or end of their shift. Information about such activities could only have come from physical observation of the officers during these times.
Conclusion
As frontline responders, patrol officers exist at the core of policing. Not only do they comprise a significant proportion of agency personnel, but their public-facing work exhibits tremendous impact on all outcomes related to policing, including crime control, public satisfaction, and public perception. By “electronically” riding along with police, we shed light on the practical work of patrol officers as well as the benefits and complications of using electronic records to measure their activities. It is our hope that our work will be as helpful from a content perspective as it is a methodological one. From the latter perspective, our research provides a toolkit for researchers to use when drawing upon electronic police records to assess research questions of an applied nature. Future research should continue to study the work of patrol officers and their implications for society.
Availability of data and materials
Not applicable.
Notes
“Riding along” refers to when a civilian accompanies a police officer in their patrol car as they conduct their policing duties. Most often such civilians are members of the general public (e.g., see Mathna & Koen, 2022), however, they can also be researchers in a scholarly context.
If we were to have conducted 60 physical ride-alongs, it would have required approximately 720 h of observation or roughly 20 weeks of full-time work.
As noted throughout, we were unable to assess undocumented activities due to our analytical approach.
We use the term, “handle,” when referring to the handling of calls for service given that we are unable to confidently assess active response to calls versus passive writing about calls for the technical reasons described in our article.
All handled calls for service require some amount of paperwork to be completed by patrol officers at this police agency, with more paperwork for more serious and/or criminal events. Time spent writing, though, is particularly difficult to measure because it can be captured via various status codes, including “OS,” “RW,” and “HQ.” We thus use the language, “to closure in the CAD system,” to account for this potential discrepancy, which we suspect may underestimate the total amount of time spent handling calls.
Between the hours of 1:00 pm and 4:59 pm, the amount of time spent in-service between status code changes ranged from 0–125 min, with a mean of 13 min.
Between the hours of 1:00am and 4:59am, the amount of time spent in-service between status code changes ranged from 0–280 min, with a mean of 40 min.
Policy for this police agency requires that officers announce these stops for safety purposes.
Consistent with this logic, some police agencies in the region have begun defaulting to the status code for enforcement in lieu of the status code for available under the belief that even when “available,” officers may still be conducting “enforcement” via their presence.
References
Bittner, E. (1967). The police on skid-row: A study of peace keeping. American Sociological Review, 32(5), 699–715.
Braga, A. A., Turchan, B. S., Papachristos, A. V., & Hureau, D. M. (2019). Hot spots policing and crime reduction: An update of an ongoing systematic review and meta-analysis. Journal of Experimental Criminology, 15(3), 289–311.
Epp, C. R., Maynard-Moody, S., & Haider-Markel, D. (2014). Pulled over: How police stops define race and citizenship. University of Chicago Press.
Famega, C. N., Frank, J., & Mazerolle, L. (2005). Managing police patrol time: The role of supervisor directives. Justice Quarterly, 22(4), 540–559.
Haberman, C. P., Clutter, J. E., & Lee, H. (2022). A robbery is a robbery is a robbery? Exploring crime specificity in official police incident data. Police Practice and Research, 23(4), 429–443.
Kelling, G. L., Pate, T., Dieckman, D., & Brown, C. E. (1974). The Kansas City preventive patrol experiment. Police Foundation.
Klinger, D. A., & Bridges, G. S. (1997). Measurement error in calls-for-service as an indicator of crime. Criminology, 35(4), 705–726.
Koper, C. S. (1995). Just enough police presence: Reducing crime and disorderly behavior by optimizing patrol time in crime hot spots. Justice Quarterly, 12(4), 649–672.
Lum, C., Koper, C. S., & Wu, X. (2021). Can we really defund the police? Police Quarterly. https://doi.org/10.1177/10986111211035002
Mathna, B. E., & Koen, M. C. (2022). Police ride-along programs: Exploring student perceptions. Police Practice and Research. https://doi.org/10.1080/15614263.2022.2105334
Maurantonio, N. (2012). Entangled webs: Forensic facticity and the construction of police work. The Communication Review, 15(1), 1–20.
Nesbary, D. K. (1998). Handling emergency calls for service: Organizational production of crime statistics. Policing: An International Journal, 21(4), 576–599.
Parks, R. B., Mastrofski, S. D., DeJong, C., & Gray, M. K. (1999). How officers spend their time with the community. Justice Quarterly, 16(3), 483–518.
Pearce, J., & Simpson, R. (2022). The role of police in conducting wellness checks: Insight from a study of police data. Police Practice and Research, 23(4), 400–413.
Ratcliffe, J. H. (2021). Policing and public health calls for service in Philadelphia. Crime Science, 10, 5.
Sierra-Arevalo, M. (2021). American policing and the danger imperative. Law & Society Review, 55(1), 70–103.
Simpson, R. (2021). Calling the police: Dispatchers as important interpreters and manufacturers of calls for service data. Policing: A Journal of Policy and Practice, 15(2), 1537–1545.
Simpson, R., & Hipp, J. R. (2019). What came first: The police or the incident? Bidirectional relationships between police actions and police incidents. Policing & Society, 29(7), 783–801.
Simpson, R., & Orosco, C. (2021). Re-assessing measurement error in police calls for service: Classifications of events by dispatchers and officers. PLoS ONE, 16(12), e0260365.
Telep, C. W., Mitchell, R. J., & Weisburd, D. (2014). How much time should the police spend at crime hot spots? Answers from a police agency directed randomized field trial in Sacramento, California. Justice Quarterly, 31(5), 905–933.
Thacher, D. (2022). Shrinking the police footprint. Criminal Justice Ethics, 41(1), 62–85.
Todak, N., & James, L. (2018). A systematic social observation study of police de-escalation tactics. Police Quarterly, 21(4), 509–543.
Varano, S., Schafer, J., Cancino, J., & Swatt, M. (2009). Constructing crime: Neighborhood characteristics and police recording behavior. Journal of Criminal Justice, 37, 553–563.
Webster, J. A. (1970). Police task and time study. The Journal of Criminal Law, Criminology and Police Science, 61(1), 94–100.
White, M. D., & Fradella, H. F. (2016). Stop and frisk: The use and abuse of a controversial policing tactic. New York University Press.
Wilson, J. (1968). Varieties of police behavior: The management of law and order in eight communities. Harvard University Press.
Wu, X., & Lum, C. (2017). Measuring the spatial and temporal patterns of police proactivity. Journal of Quantitative Criminology, 33(4), 915–934.
Wu, X., & Lum, C. (2020). The practice of proactive traffic stops. Policing: An International Journal, 43(2), 229–246.
Acknowledgements
Not applicable.
Funding
No outside funding was used to support this work.
Author information
Authors and Affiliations
Contributions
Both authors read and approved the final manuscript.
Authors' information
Rylan Simpson, Ph.D. is an Assistant Professor in the School of Criminology at Simon Fraser University. His research interests include policing, perceptions of police, police organisations, theories of crime, and social psychology. He approaches his research using a variety of different methodologies, including experimental and quantitative analyses. He has recently published his work in Criminology & Public Policy, PLoS ONE, Journal of Experimental Criminology, Justice Evaluation Journal, Women & Criminal Justice, and Policing: A Journal of Policy and Practice. He has participated in approximately 1,300 h of police ride-alongs in Canada, Australia, the United States, and the United Kingdom as well as worked as a police dispatcher in British Columbia since 2012.
Nick Bell is an Inspector with the West Vancouver Police Department. He currently oversees the Administration Division. Nick is also a sessional instructor at the Justice Institute of British Columbia and the Director of Education for the Canadian Society of Evidence-Based Policing. Nick is working on his Ph.D. in Applied Criminology at the University of Huddersfield, researching perceptions of safety and security. Nick has been involved in a number of research projects internally, externally, and with academics.
Corresponding author
Ethics declarations
Competing interests
The second author is intimately connected with the police agency and data analysed as part of this research. With that being said, neither author has any financial interest in this research.
Additional information
Publisher's Note
Springer Nature remains neutral with regard to jurisdictional claims in published maps and institutional affiliations.
Rights and permissions
Open Access This article is licensed under a Creative Commons Attribution 4.0 International License, which permits use, sharing, adaptation, distribution and reproduction in any medium or format, as long as you give appropriate credit to the original author(s) and the source, provide a link to the Creative Commons licence, and indicate if changes were made. The images or other third party material in this article are included in the article's Creative Commons licence, unless indicated otherwise in a credit line to the material. If material is not included in the article's Creative Commons licence and your intended use is not permitted by statutory regulation or exceeds the permitted use, you will need to obtain permission directly from the copyright holder. To view a copy of this licence, visit http://creativecommons.org/licenses/by/4.0/. The Creative Commons Public Domain Dedication waiver (http://creativecommons.org/publicdomain/zero/1.0/) applies to the data made available in this article, unless otherwise stated in a credit line to the data.
About this article

Cite this article
Simpson, R., Bell, N. Unpacking the police patrol shift: observations and complications of “electronically” riding along with police. Crime Sci 11, 15 (2022). https://doi.org/10.1186/s40163-022-00178-9
Received:
Accepted:
Published:
DOI: https://doi.org/10.1186/s40163-022-00178-9